Fast plotting of the empirical cumulative distribution function (ECDF), designed to stay performant even for very large vectors (n ~ 1e6-1e7).
Usage
plotECDF(x, ...)

# Default S3 method
plotECDF(
  x,
  main = NULL,
  xlab = NULL,
  ylab = "",
  xlim = NULL,
  breaks = 1000,
  add = FALSE,
  col = .useTheme,
  lwd = 2,
  grid = .useTheme,
  box = .useTheme,
  stamp = .useTheme,
  ...
)

# S3 method for class 'formula'
plotECDF(
  formula,
  data,
  subset,
  na.action = na.omit,
  main = NULL,
  xlab = NULL,
  xlim = NULL,
  col = .useTheme,
  lwd = 2,
  legend = TRUE,
  stamp = .useTheme,
  ...
)
Arguments
- x
numeric vector of the observations for the ECDF. Missing values are removed.
- ...
further graphical parameters passed to
par()via the internal framework.- main
main title.
NULL(default) draws none, unless the theme setsautoTitle = TRUE(see theme); the title is then derived from the expression passed asx."",NAorFALSEalways suppress it and compact the top margin; any other string is used as given.- xlab
label for the x-axis.
NULL(default) derives a label the same way asmain.- ylab
label for the y-axis. The y-axis itself always shows fixed probability labels (
.00to1.00);ylabadds an axis title above/beside those, empty by default.- xlim
numeric vector of length 2; x-axis limits.
NULL(default) usesrange(x).- breaks
controls the rendered resolution. A single integer (default
1000) subsamples the ECDF at that many evenly-spaced quantiles wheneverlength(x)exceeds it; forlength(x) <= breaks, full resolution is used regardless (no data is ever thinned below its actual size).NULL,FALSE, orInfforce full resolution unconditionally, regardless oflength(x).- add
logical; if
TRUE, adds to an existing plot instead of starting a new one.- col
color of the step line and the min/max marker points.
.useTheme(default) resolves togetTheme()$twin[1]- a single accent color, consistent withlines.loess()andplotQQ()'s confidence band.- lwd
line width.
- grid
controls drawing of the background grid (vertical lines at default tick positions, plus a fixed set of horizontal reference lines at the probability ticks
0/.25/.5/.75/1the latter always grey regardless of the active theme, a deliberately distinct look, not theme-driven).
.useTheme(default) follows the active theme's grid on/off state (getTheme()$grid).TRUE/FALSE/NA, or a named list, as forgraphics::grid().
- box
controls drawing of the plot box.
.useTheme(default) resolves togetTheme()$box.TRUE/FALSE/NA, or a named list, as forgraphics::box().- stamp
controls the corner stamp.
.useTheme(default) resolves togetTheme()$stamp.TRUE/FALSE/NULL, a string, or a named list of arguments forstamp().- formula
a formula of the form
y ~ group, one ECDF per group, ory ~ a:bfor the cells of several grouping variables.y ~ a + bis not accepted, seebedrock::resolveFormula().- data
an optional data frame containing the variables in the formula.
- subset
an optional expression indicating which observations to use, evaluated in
data(subset = len > 10), as inboxplot().- na.action
a function specifying how missing values are handled. Defaults to
na.omit.- legend
controls the legend of the formula method, drawn with the group levels.
TRUE(default) draws it with default settings,FALSE/NULL/NAsuppress it, a named list is passed on tographics::legend()(e.g.list(x = "topleft")).
Details
The base plot.ecdf()/ecdf() machinery becomes
impractically slow well below n = 1e7, since it tracks every single
jump. Beyond a few thousand points, individual jumps are visually
indistinguishable anyway, so plotECDF() caps the rendered resolution
at breaks points by default.
Resolution is achieved via quantile subsampling, not histogram binning:
breaks evenly-spaced probability points are mapped back to their
corresponding quantiles (stats::quantile(), type = 7).
Each rendered point therefore lies exactly on the true ECDF - unlike an
equal-width-histogram approximation, this adapts automatically to the
shape of the distribution (no resolution is wasted on near-empty bins in
a skewed or heavy-tailed distribution, nor lost in the tails).
See also
plot.ecdf(), plotFreqDist(),
theme
Other plot.univariate:
plotArea(),
plotBar(),
plotBox(),
plotCatDist(),
plotDens(),
plotDensBox(),
plotDot(),
plotFreqDist(),
plotLines(),
plotQQ(),
plotViolin()
Examples
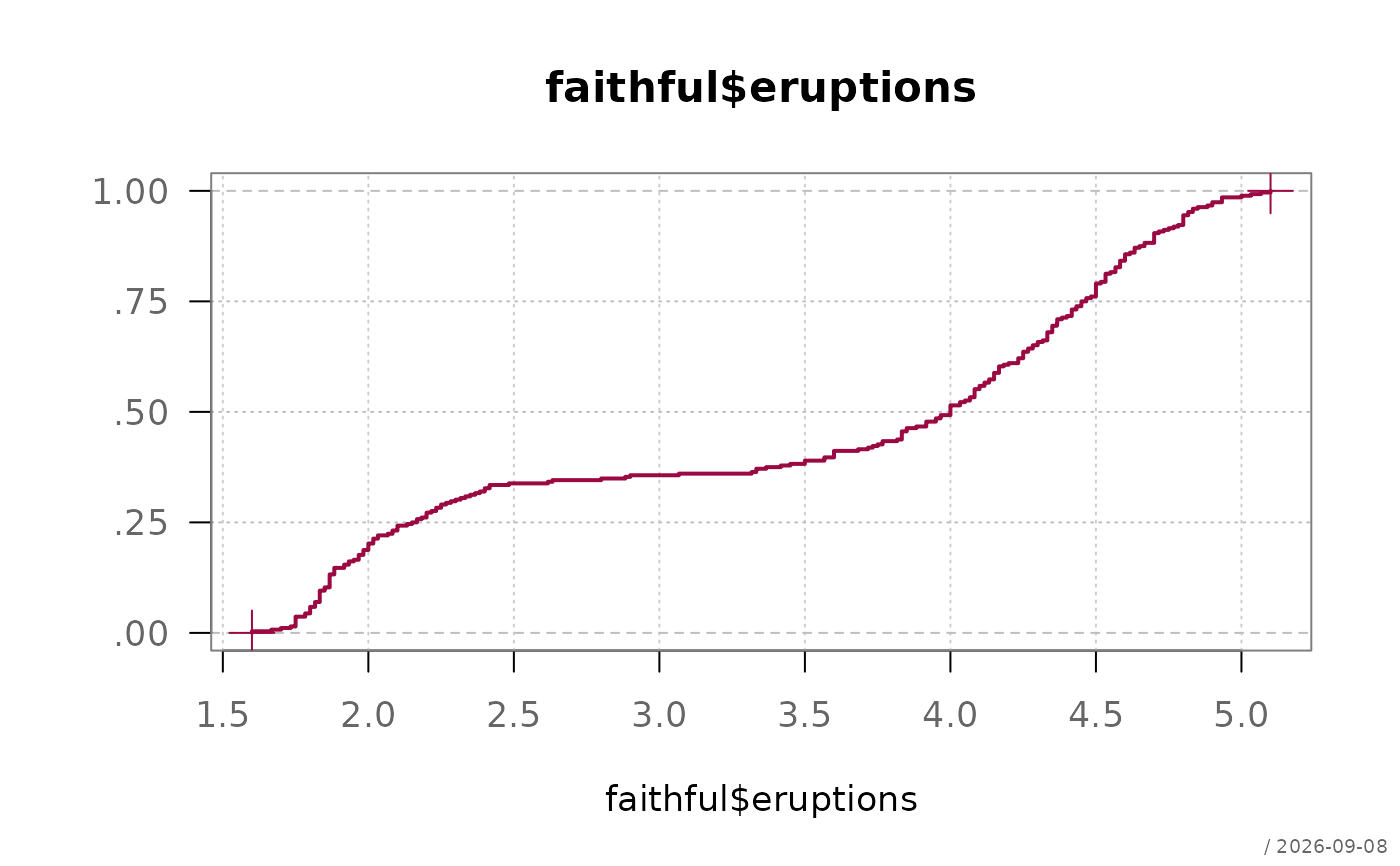
plotECDF(faithful$eruptions)
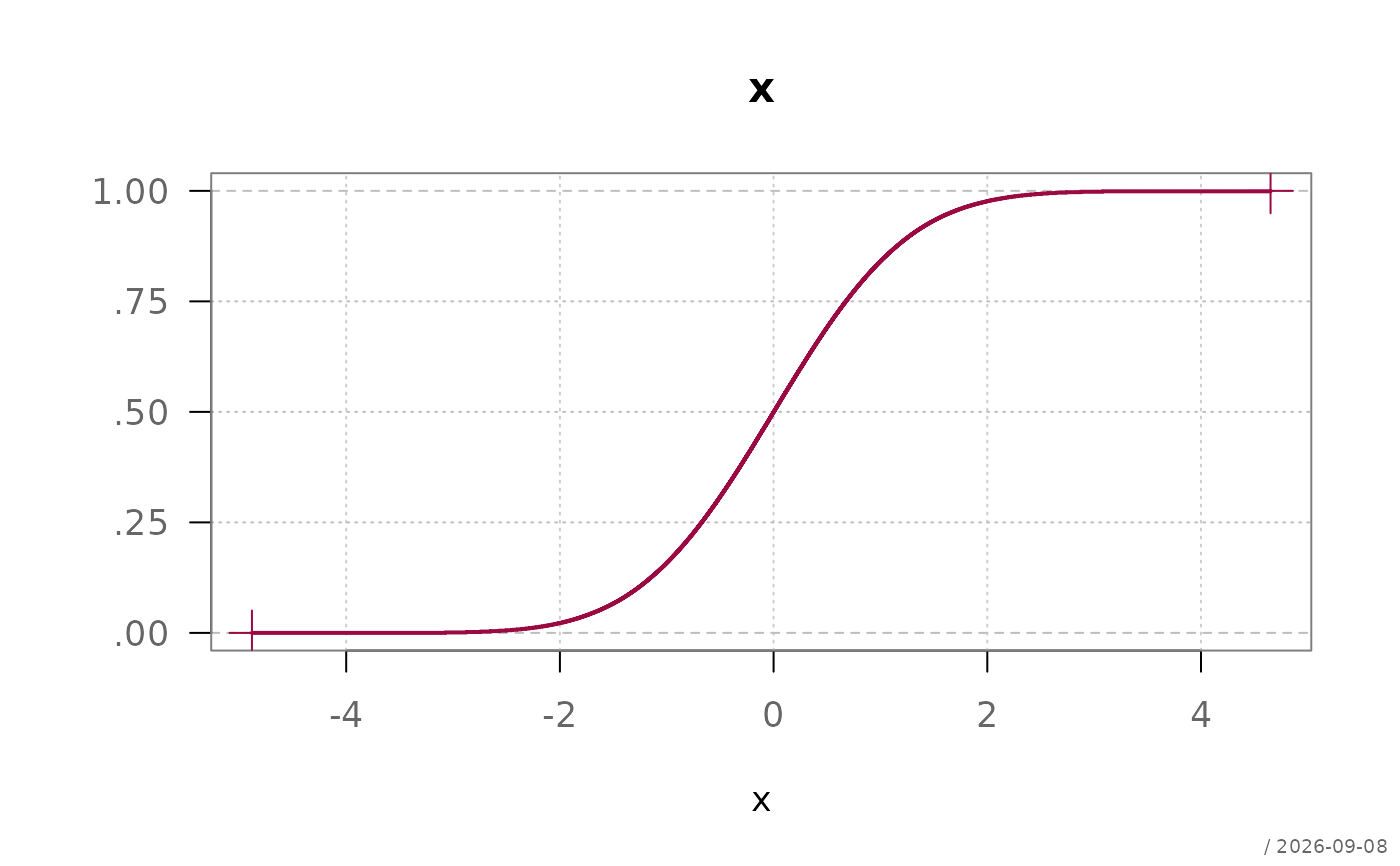
 # large vector - automatically thinned to 1000 points, no breaks= needed
x <- rnorm(1e6)
plotECDF(x)
# large vector - automatically thinned to 1000 points, no breaks= needed
x <- rnorm(1e6)
plotECDF(x)
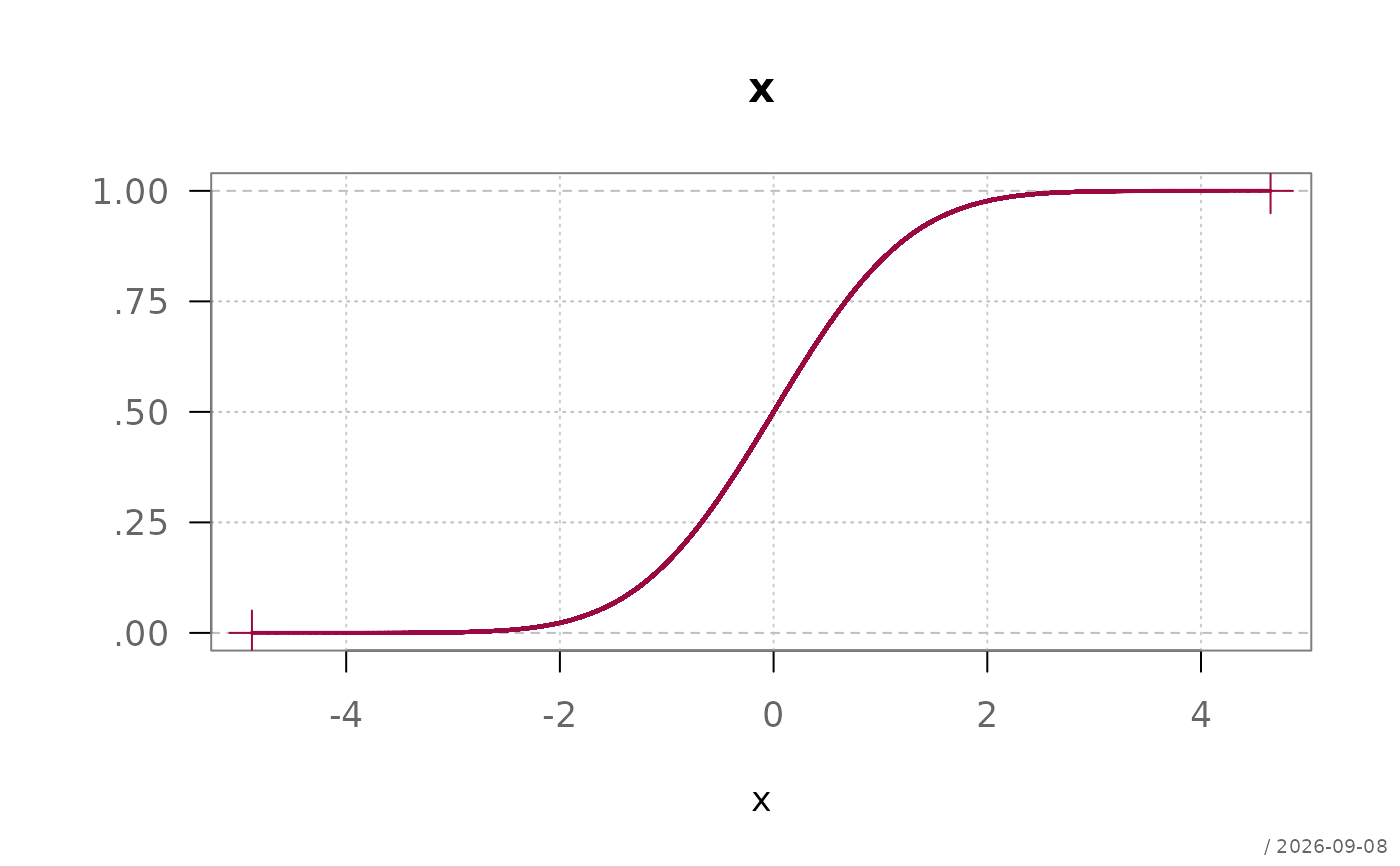
 # force full resolution regardless of size
plotECDF(x, breaks = NULL)
# force full resolution regardless of size
plotECDF(x, breaks = NULL)
 # grouped ECDFs via the formula interface
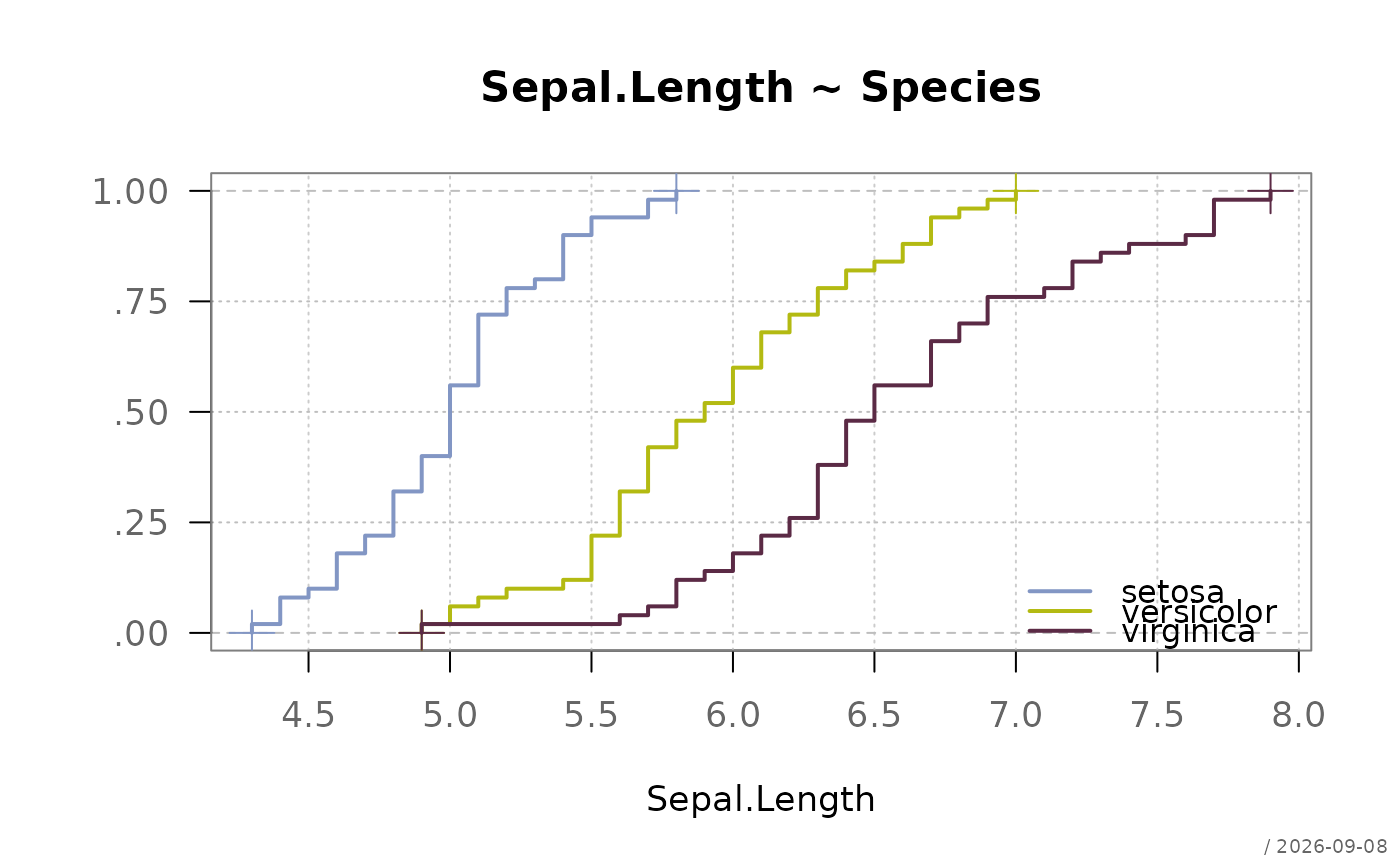
plotECDF(Sepal.Length ~ Species, data = iris)
# grouped ECDFs via the formula interface
plotECDF(Sepal.Length ~ Species, data = iris)
 # subset and the cells of two grouping variables
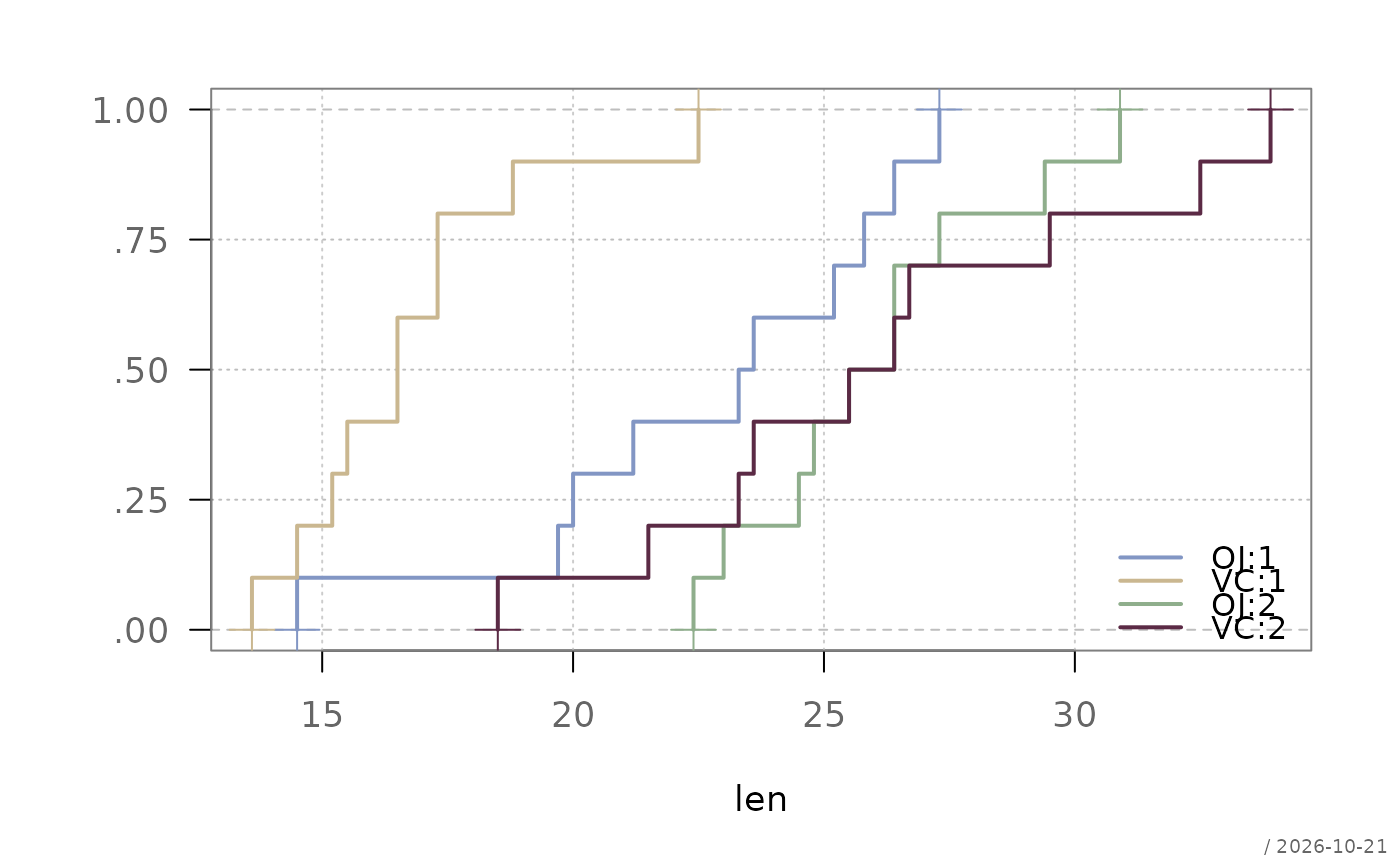
plotECDF(len ~ supp:dose, ToothGrowth, subset = dose > 0.5)
# subset and the cells of two grouping variables
plotECDF(len ~ supp:dose, ToothGrowth, subset = dose > 0.5)