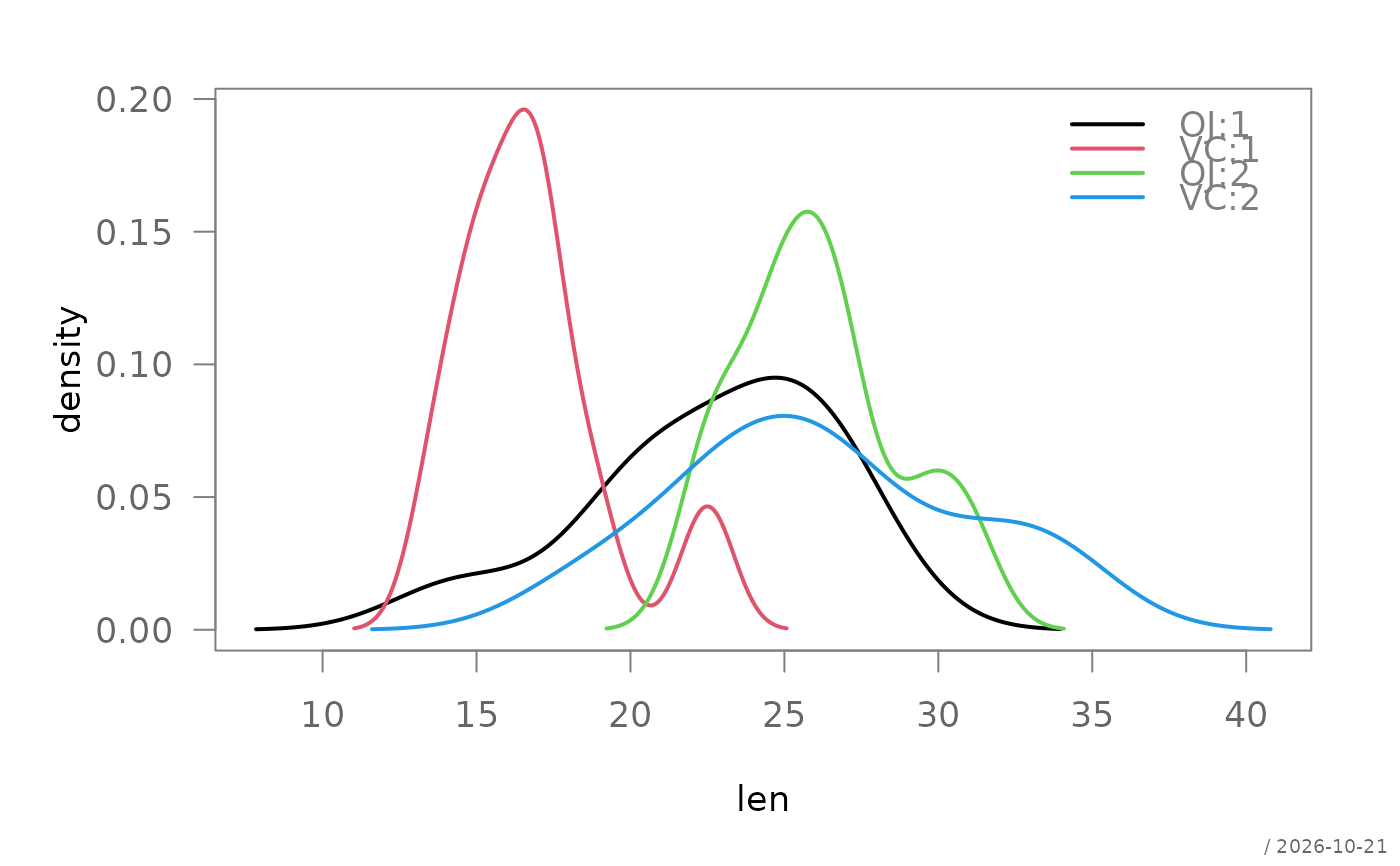
Draws kernel density estimates for one or more groups. Supports both classical density plots and conditional density plots.
Usage
plotDens(x, ...)

# Default S3 method
plotDens(
  x,
  ...,
  main = NULL,
  xlab = "",
  ylab = "density",
  xlim = NULL,
  ylim = NULL,
  bw = "nrd0",
  add = FALSE,
  col = NULL,
  lwd = 2,
  lty = 1,
  fill = FALSE,
  grid = NULL,
  legend = TRUE,
  stamp = .useTheme
)

# S3 method for class 'formula'
plotDens(
  formula,
  data,
  subset,
  na.action = na.omit,
  main = NULL,
  xlab = "",
  ylab = NULL,
  type = NULL,
  ...
)
Arguments
- x
A numeric vector or list of numeric vectors.
- ...
additional data vectors (unnamed, default method) or graphical parameters passed to
par().- main
main title.
NULL(default) draws none, unless the theme setsautoTitle = TRUE(see theme); the title is then derived from the input: the names of the data arguments, or the formula."",NAorFALSEalways suppress it and compact the top margin; any other string is used as given.- xlab, ylab
axis labels.
- xlim, ylim
axis limits.
NULL(default) uses the range of the densities, the y-axis starting at 0 (c(0, 1)for a conditional density).- bw
bandwidth passed to
stats::density()orcdplot.- add
logical; if
TRUE, adds to an existing plot.- col
line color(s).
- lwd
line width(s).
- lty
line type(s).
- fill
for
type = "density":FALSE(default, no fill),TRUE(translucent fill derived from each group'scolviaadjustcolor(col, alpha.f = 0.3)), or one or more explicit fill colors recycled over groups. Fortype = "conditional"on a single, unstratified, binary curve:TRUEfor cdplot-style grey shading, or a vector of 2 colors for the regions below/above the boundary curve.- grid
logical,
NA, or list controlling background grid.- legend
controls the legend, drawn only for more than one curve, with the group names (the level names for the formula method, the names of the data arguments otherwise).
TRUE(default) draws it with default settings,FALSE/NULL/NAsuppress it, a named list is passed on tographics::legend()(e.g.list(x = "topleft")).- stamp
controls the corner stamp.
.useTheme(default) resolves togetTheme()$stamp.TRUE/FALSE/NULL, or an explicit string, as for.withGraphicsState()(internal).- formula
a formula of the form
y ~ group(ory ~ a:bfor the cells of several grouping variables),y ~ x(xnumeric, conditional density), ory ~ x | group.y ~ a + bis not accepted, seebedrock::resolveFormula().- data
an optional data frame containing the variables in the formula.
- subset
an optional expression indicating which observations to use, evaluated in
data(subset = len > 10), as inboxplot().- na.action
a function specifying how missing values are handled, defaults to
na.omit().- type
character string specifying the plot type. One of
"density","conditional", orNULL(default, determined byresolveFormula()'s design classification).
Details
The function defers entirely to bedrock::resolveFormula()'s
design classification to pick a mode when type = NULL:
y ~ g(gcategorical) → density, one curve per group.y ~ x(xnumeric) → conditional density \(P(Y | X)\), a single curve - equivalent tocdplot(x, factor(y)).y ~ x | g→ conditional density, one curve per level ofg.
type can be set explicitly to override the default for a given
design (e.g. to force an error rather than silently doing the wrong
thing if a formula's shape is ambiguous).
Graphical elements such as grids are controlled via the unified plot
design system using bedrock::callIf() and .theme().
See also
stats::density(), graphics::cdplot(),
bedrock::resolveFormula()
Other plot.univariate:
plotArea(),
plotBar(),
plotBox(),
plotCatDist(),
plotDensBox(),
plotDot(),
plotECDF(),
plotFreqDist(),
plotLines(),
plotQQ(),
plotViolin()
Examples
set.seed(1)
x <- rnorm(100)
g <- rep(c("A", "B"), each = 50)
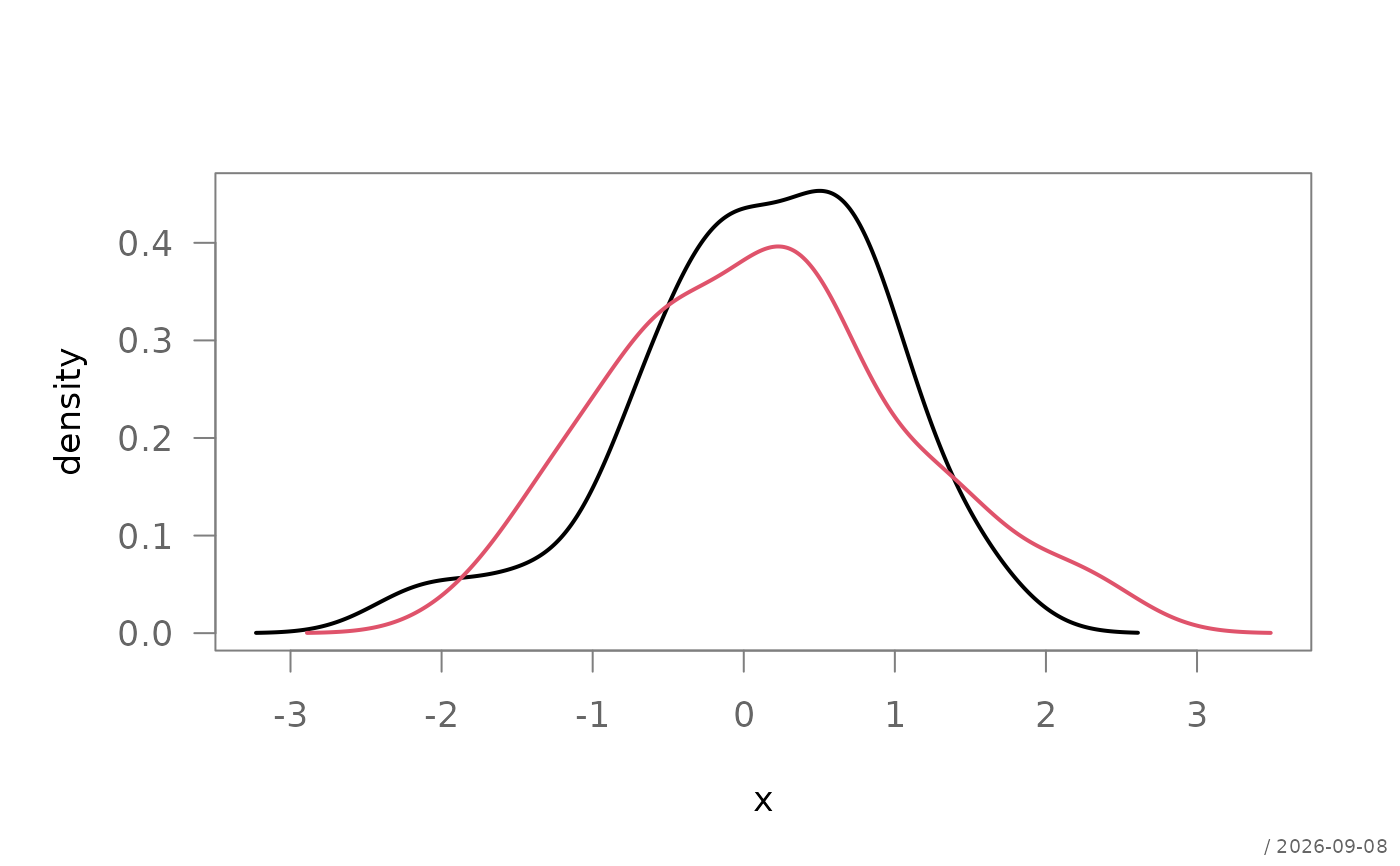
# standard density (k = 2 groups)
plotDens(x ~ g)
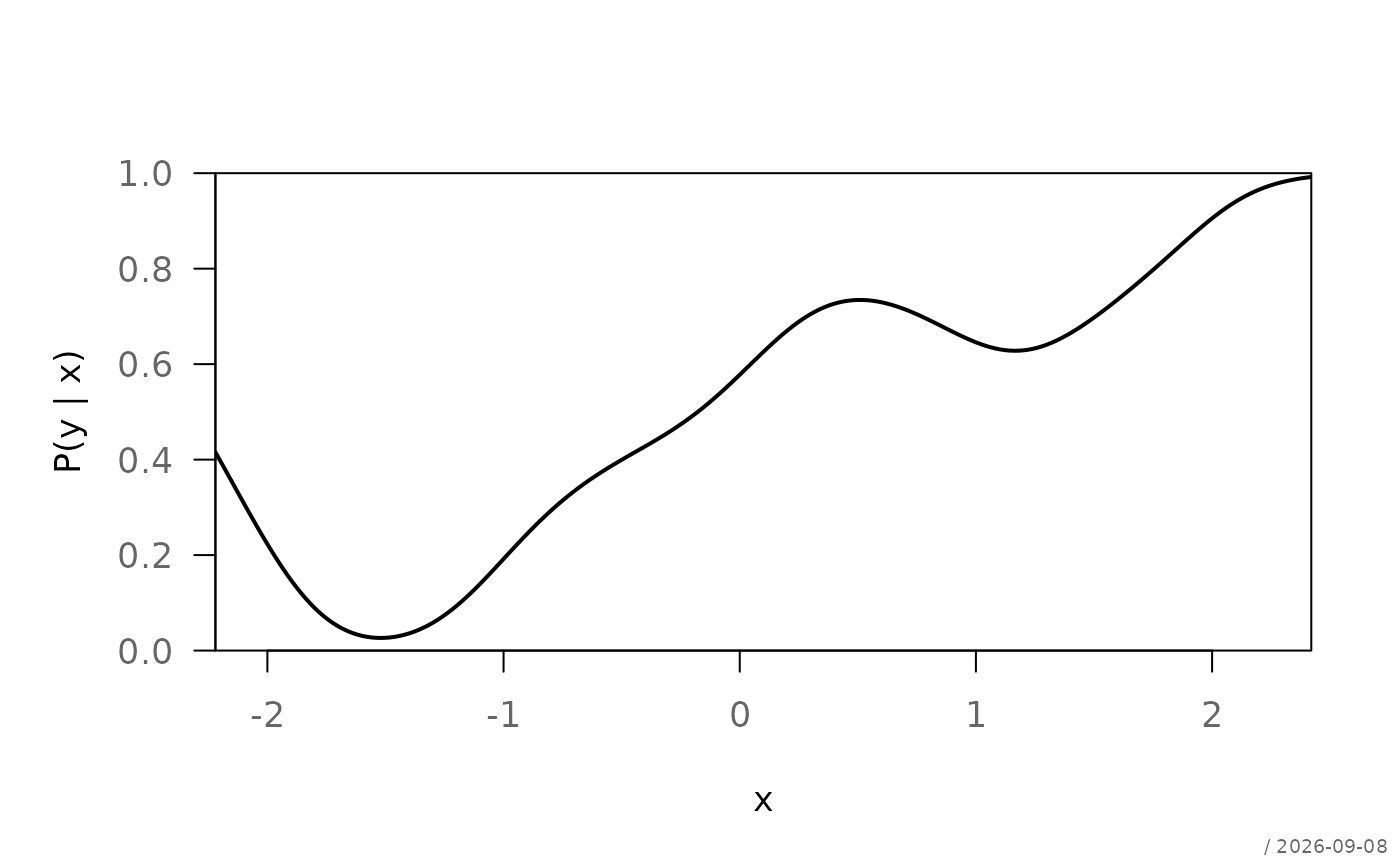
 # conditional density, single curve - auto-detected, no type= needed
y <- rbinom(100, 1, plogis(x))
plotDens(y ~ x)
# conditional density, single curve - auto-detected, no type= needed
y <- rbinom(100, 1, plogis(x))
plotDens(y ~ x)
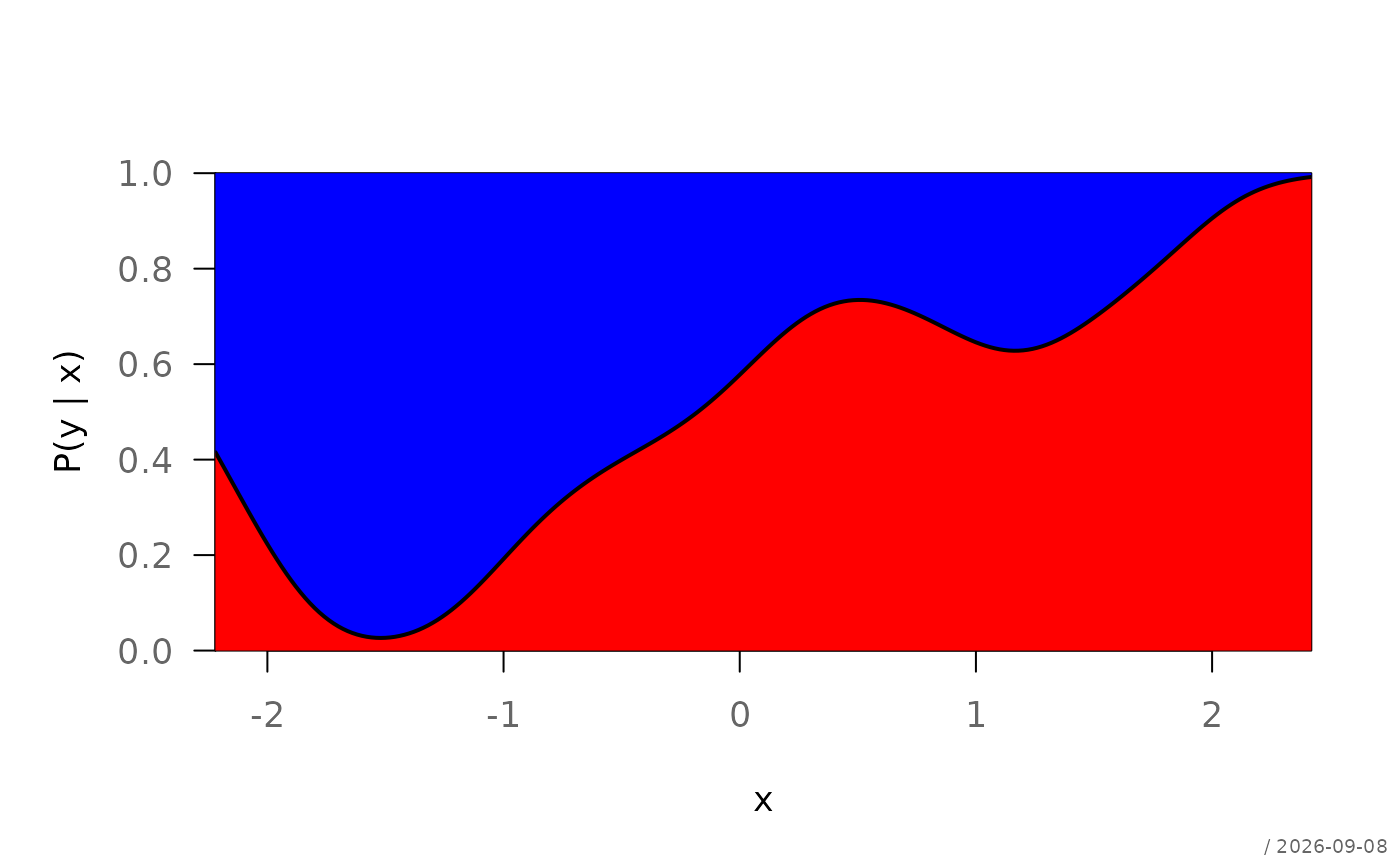
 # same, with cdplot-style fill
plotDens(y ~ x, fill = c("red", "blue"))
# same, with cdplot-style fill
plotDens(y ~ x, fill = c("red", "blue"))
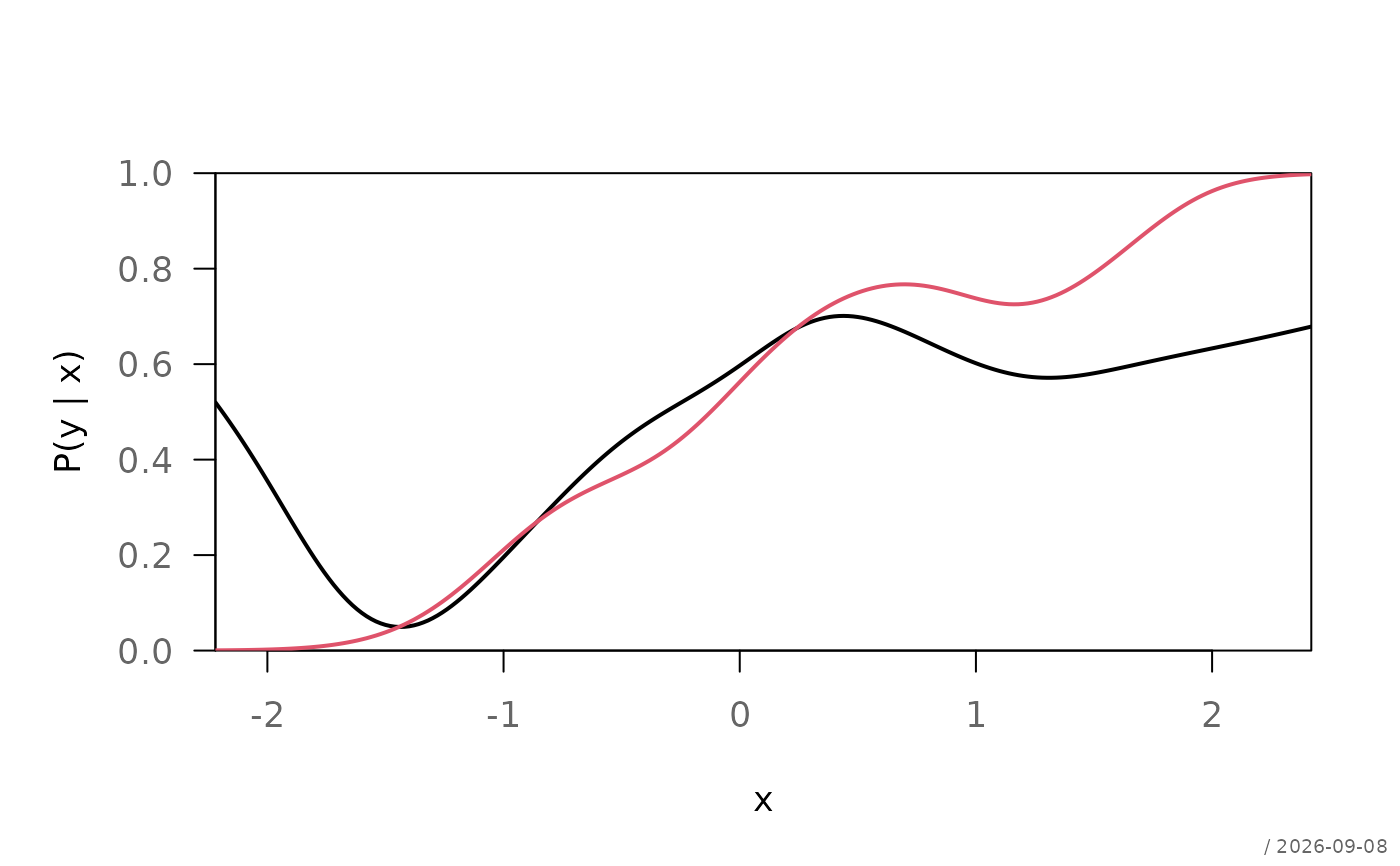
 # conditional density, stratified by group
plotDens(y ~ x | g)
# conditional density, stratified by group
plotDens(y ~ x | g)
 # subset and the cells of two grouping variables
plotDens(len ~ supp:dose, ToothGrowth, subset = dose > 0.5)
# subset and the cells of two grouping variables
plotDens(len ~ supp:dose, ToothGrowth, subset = dose > 0.5)