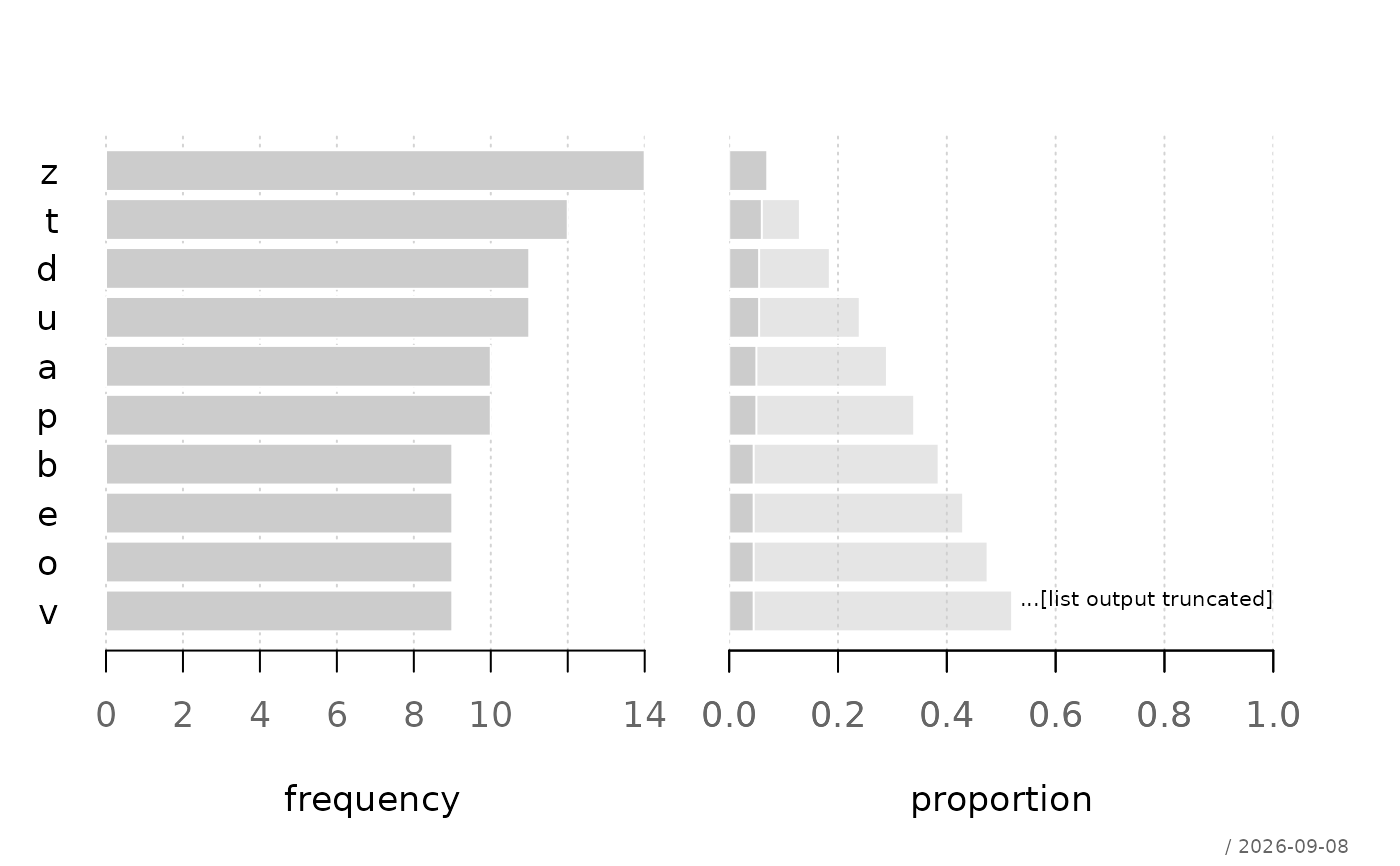
Visualizes the distribution of a categorical variable using horizontal bar plots of absolute and relative frequencies. Optionally, cumulative proportions (ECDF-style) can be displayed.
Usage
plotCatDist(
  x,
  main = NULL,
  type = c("both", "freq", "perc"),
  ecdf = FALSE,
  maxCats = NULL,
  maxLabLen = 25,
  col = "grey80",
  border = FALSE,
  stamp = .useTheme,
  ...
)
Arguments
- x
a factor or character vector, a one-dimensional table of counts, or a numeric vector of precomputed frequencies. Unnamed numeric frequency vectors are labelled by their positions.
- main
plot title.
- type
character; one of
"both","freq","perc". Controls whether absolute frequencies, relative frequencies, or both are displayed.- ecdf
logical; if
TRUE, cumulative proportions are shown instead of simple relative frequencies.- maxCats
optional maximum number of categories to display (truncates if exceeded).
- maxLabLen
integer; maximum length of category labels before truncation.
- col
fill color for bars.
- border
logical; draw borders around bars.
- stamp
controls the corner stamp.
.useTheme(default) resolves togetTheme()$stamp.TRUE/FALSE/NULL, a string, or a named list forstamp().- ...
further graphical parameters passed to
par().
Details
The function produces horizontal bar plots:
Absolute frequencies (counts)
Relative frequencies (percentages) or cumulative proportions
If type = "both", both views are shown side by side.
Long labels are truncated, and large category sets can be limited via
maxCats.
Raw categorical data and their pre-tabulated form are treated identically.
When categories are truncated via maxCats, proportions remain based
on the total frequency before truncation.
See also
Other plot.univariate:
plotArea(),
plotBar(),
plotBox(),
plotDens(),
plotDensBox(),
plotDot(),
plotECDF(),
plotFreqDist(),
plotLines(),
plotQQ(),
plotViolin()
Examples
# Basic usage
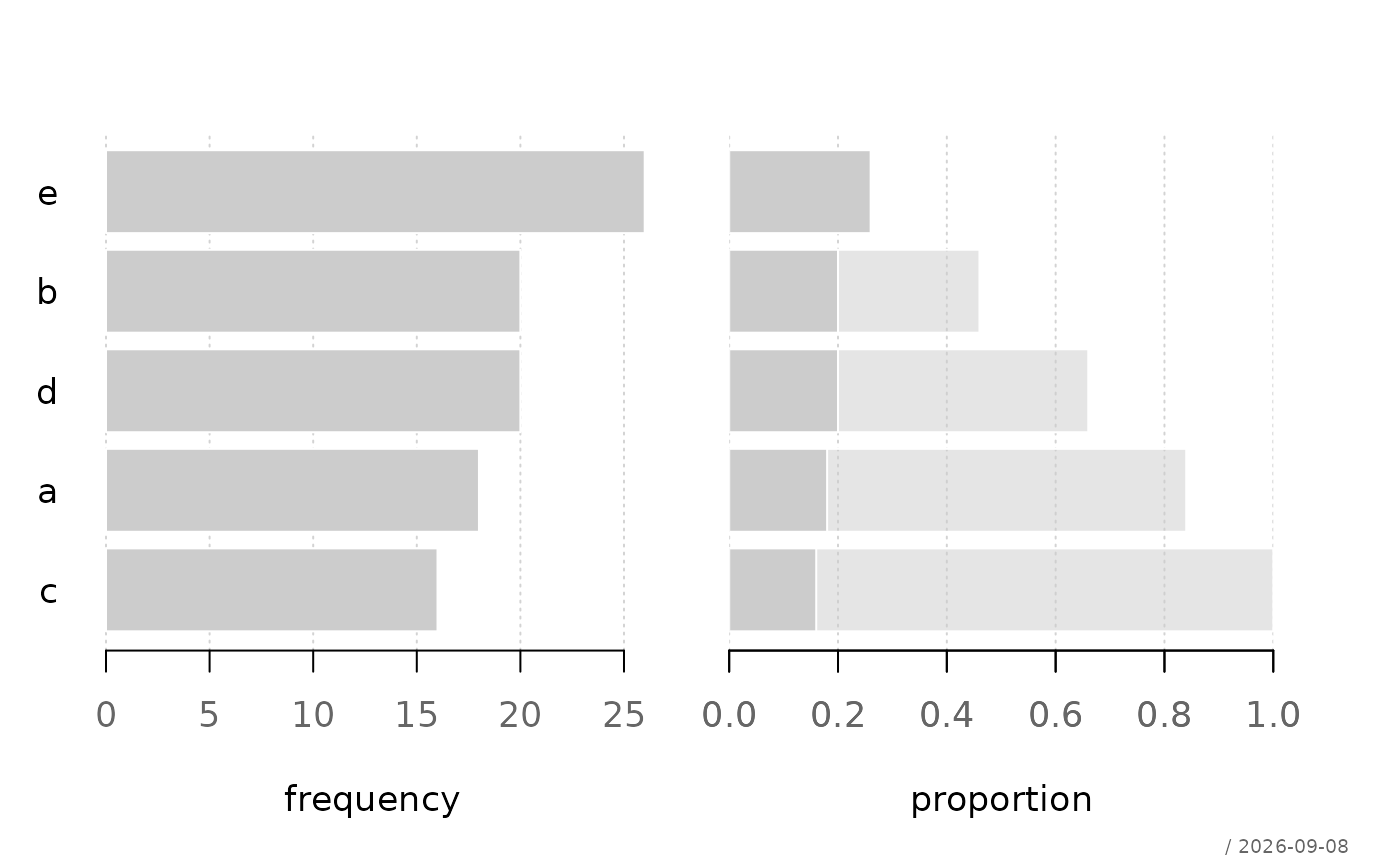
x <- factor(sample(letters[1:5], 100, TRUE))
plotCatDist(x)
 plotCatDist(table(x))
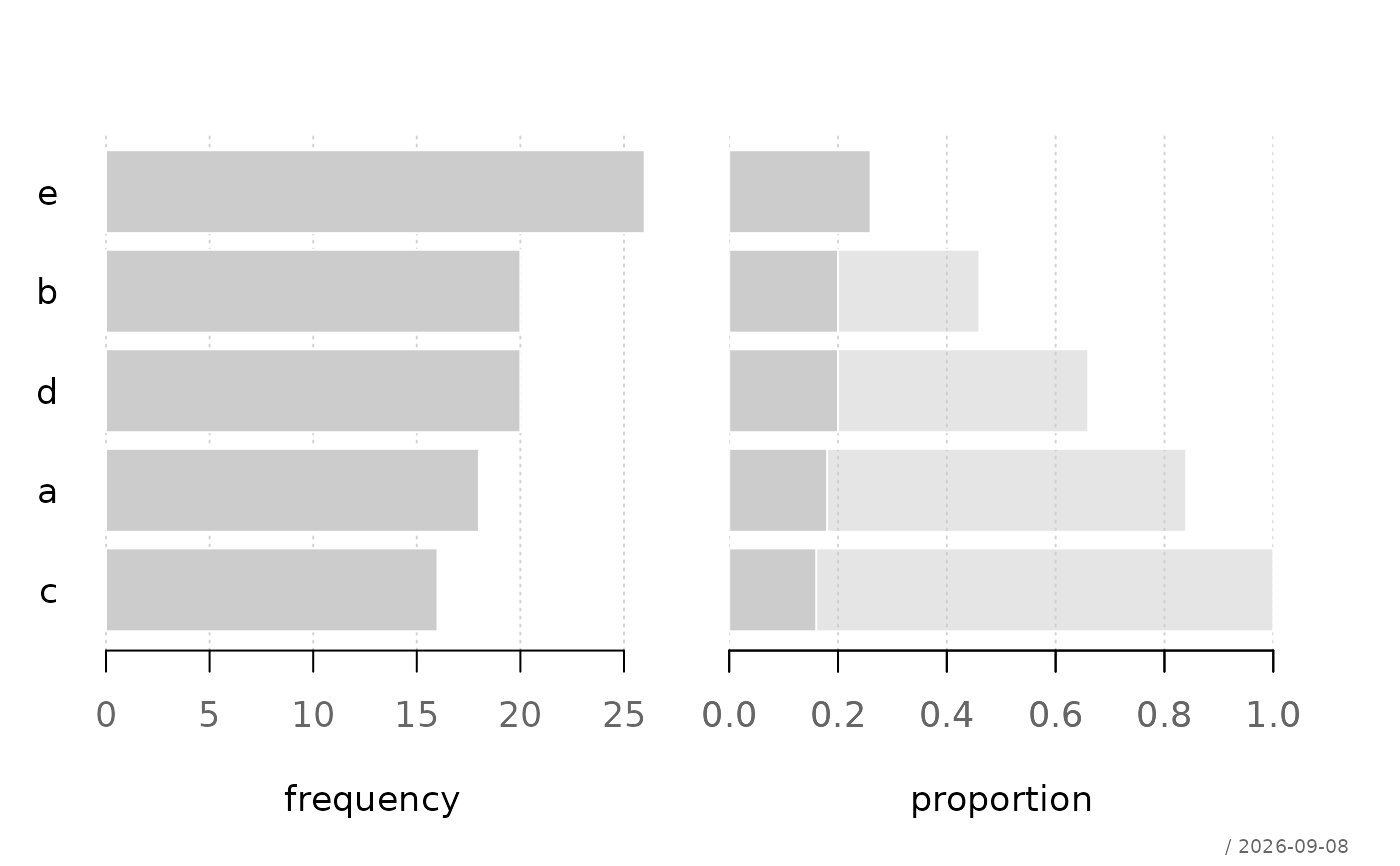 # Only proportions
plotCatDist(x, type = "perc")
# Only proportions
plotCatDist(x, type = "perc")
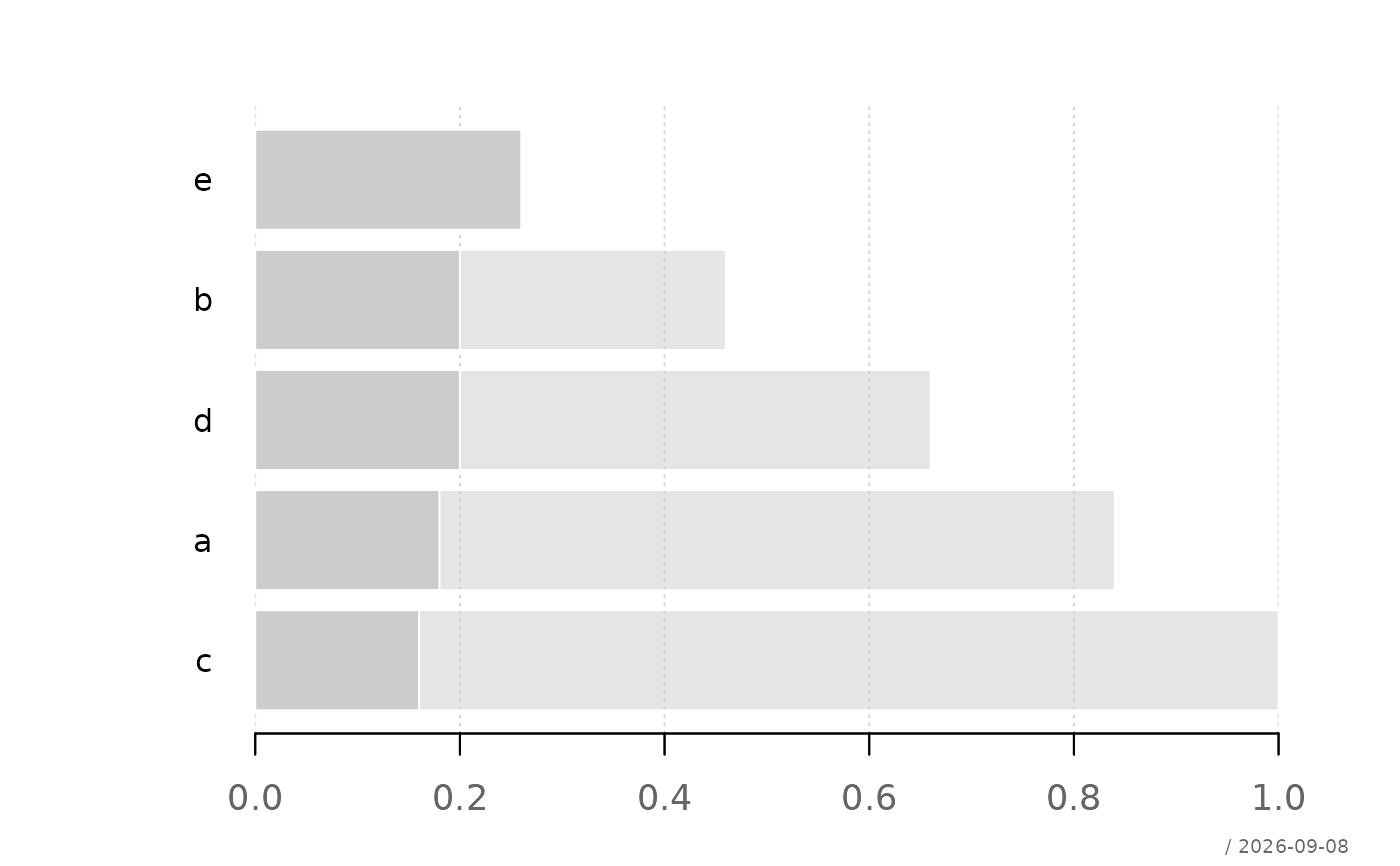 # With cumulative distribution
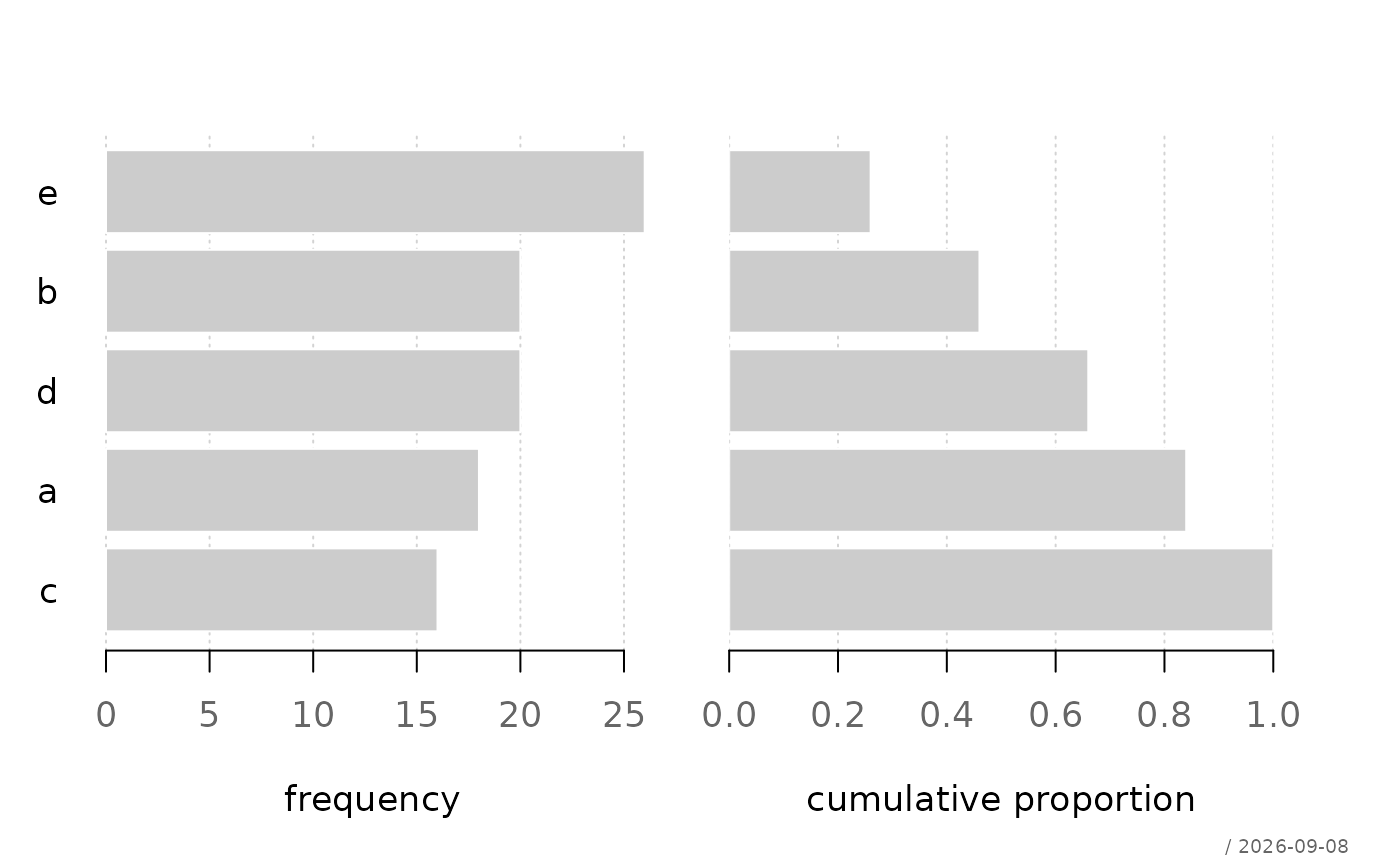
plotCatDist(x, ecdf = TRUE)
# With cumulative distribution
plotCatDist(x, ecdf = TRUE)
 # Many categories (truncation)
x2 <- factor(sample(letters, 200, TRUE))
plotCatDist(x2, maxCats = 10)
# Many categories (truncation)
x2 <- factor(sample(letters, 200, TRUE))
plotCatDist(x2, maxCats = 10)