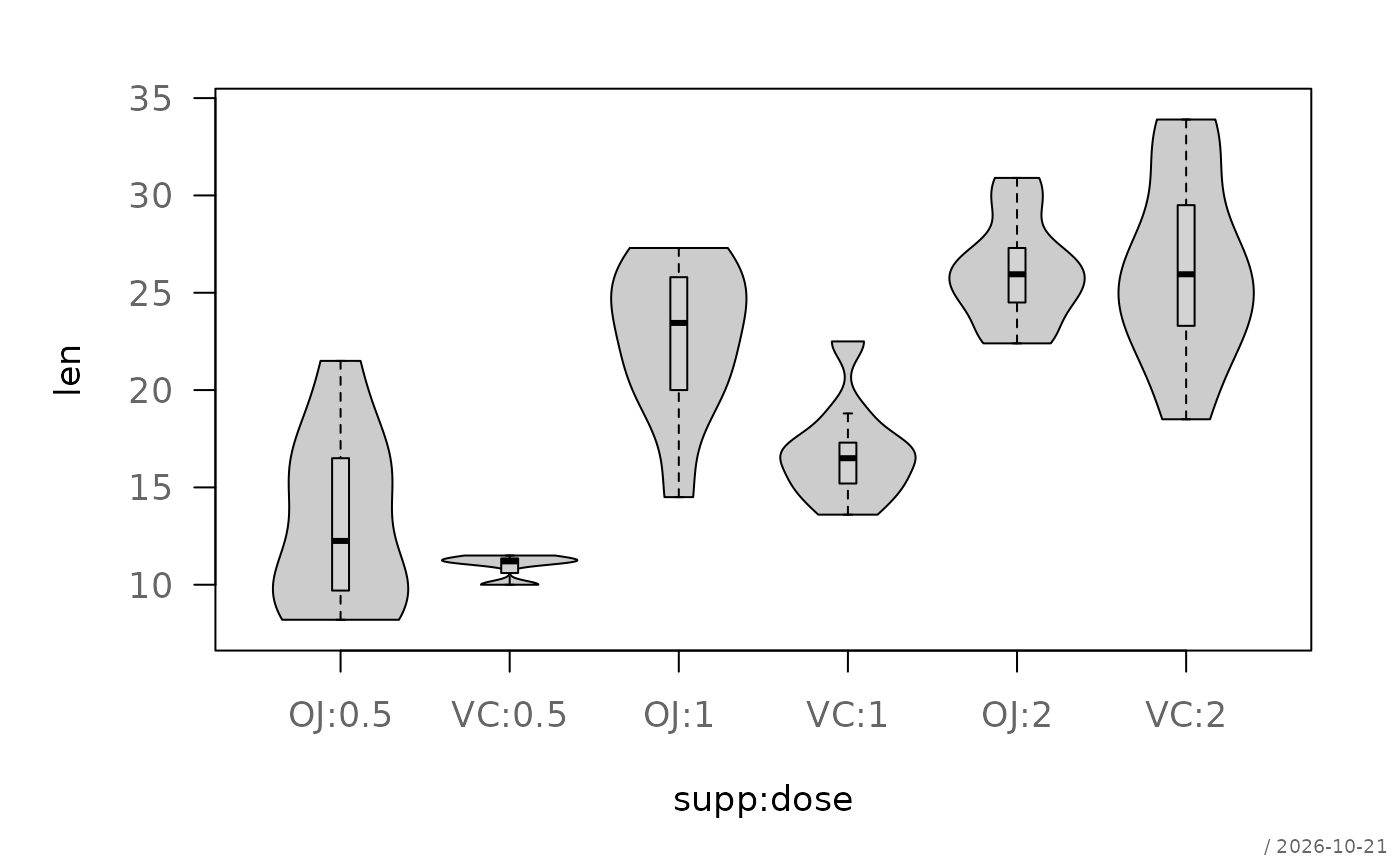
Draws violin plots for one or more groups, combining kernel density estimation with optional boxplot overlays. The function follows a boxplot-like interface and supports both default and formula methods.
Usage
plotViolin(x, ...)

# Default S3 method
plotViolin(
  x,
  ...,
  main = NULL,
  xlab = "",
  ylab = "",
  xlim = NULL,
  ylim = NULL,
  bw = "nrd0",
  trim = TRUE,
  horiz = FALSE,
  at = NULL,
  names = NULL,
  add = FALSE,
  col = "grey80",
  border = "black",
  lwd = 1,
  grid = NA,
  box = TRUE,
  quantiles = NULL,
  stamp = .useTheme
)

# S3 method for class 'formula'
plotViolin(
  formula,
  data,
  subset,
  na.action = na.omit,
  main = NULL,
  xlab = "",
  ylab = "",
  horiz = FALSE,
  names = NULL,
  ...
)
Arguments
- x
numeric vector, list of numeric vectors, or first group.
- ...
additional data vectors (unnamed) or graphical parameters passed to
par().- main
main title.
NULL(default) draws none, unless the theme setsautoTitle = TRUE(see theme); the title is then derived from the input: the names of the data arguments, or the formula."",NAorFALSEalways suppress it and compact the top margin; any other string is used as given.- xlab, ylab
axis labels. For the formula method, empty labels default to the grouping variable and the response.
- xlim, ylim
axis limits.
NULL(default) uses the range of the densities, padded by 2%; given limits are used as they are.- bw
bandwidth specification passed to
density().- trim
logical. If
TRUE(default), the kernel density estimate of each group is restricted to the observed data range (from = min(x),to = max(x)), so the violin never extends beyond the actual data — matching the default behavior ofggplot2::geom_violin(). IfFALSE,density()is called with its own defaults, which extend the tails up tocut * bwbeyondrange(x)and may produce violins that reach into implausible values (e.g. scores above 100 or below 0).- horiz
logical; if
TRUE, draws horizontal violins.- at
numeric positions of the groups.
- names
optional group labels.
- add
logical; if
TRUE, adds to an existing plot.- col
fill color(s) of the violins.
- border
border color(s) of the violins.
- lwd
line width for violin borders.
- grid
logical,
NA, or list controlling background grid.- box
logical or list controlling the boxplot overlay (see Details).
- quantiles
optional numeric vector of probabilities for drawing quantile lines inside each violin.
- stamp
controls the corner stamp.
.useTheme(default) resolves togetTheme()$stamp.TRUE/FALSE/NULL, a string, or a named list forstamp().- formula
a formula of the form
y ~ group, ory ~ a:bfor the cells of several grouping variables.y ~ a + bis not accepted (unlikeboxplot()), seebedrock::resolveFormula().- data
an optional data frame containing the variables in the formula.
- subset
an optional expression indicating which observations to use, evaluated in
data(subset = len > 10), as inboxplot().- na.action
a function specifying how missing values are handled, defaults to
na.omit().
Details
The violin shape is constructed from a kernel density estimate of each group, scaled to a fixed maximum width. Optionally, boxplots and quantile lines can be added.
Graphical elements such as the boxplot overlay and grid are controlled
via a flexible interface using TRUE, FALSE, NA, or
list(...) and are evaluated using bedrock::callIf().
Data Handling
The function accepts:
a numeric vector
multiple vectors via
...a list of numeric vectors
Groups are handled similarly to boxplot().
See also
Other plot.univariate:
plotArea(),
plotBar(),
plotBox(),
plotCatDist(),
plotDens(),
plotDensBox(),
plotDot(),
plotECDF(),
plotFreqDist(),
plotLines(),
plotQQ()
Examples
set.seed(1)
x <- rnorm(100)
y <- rnorm(100, 1)
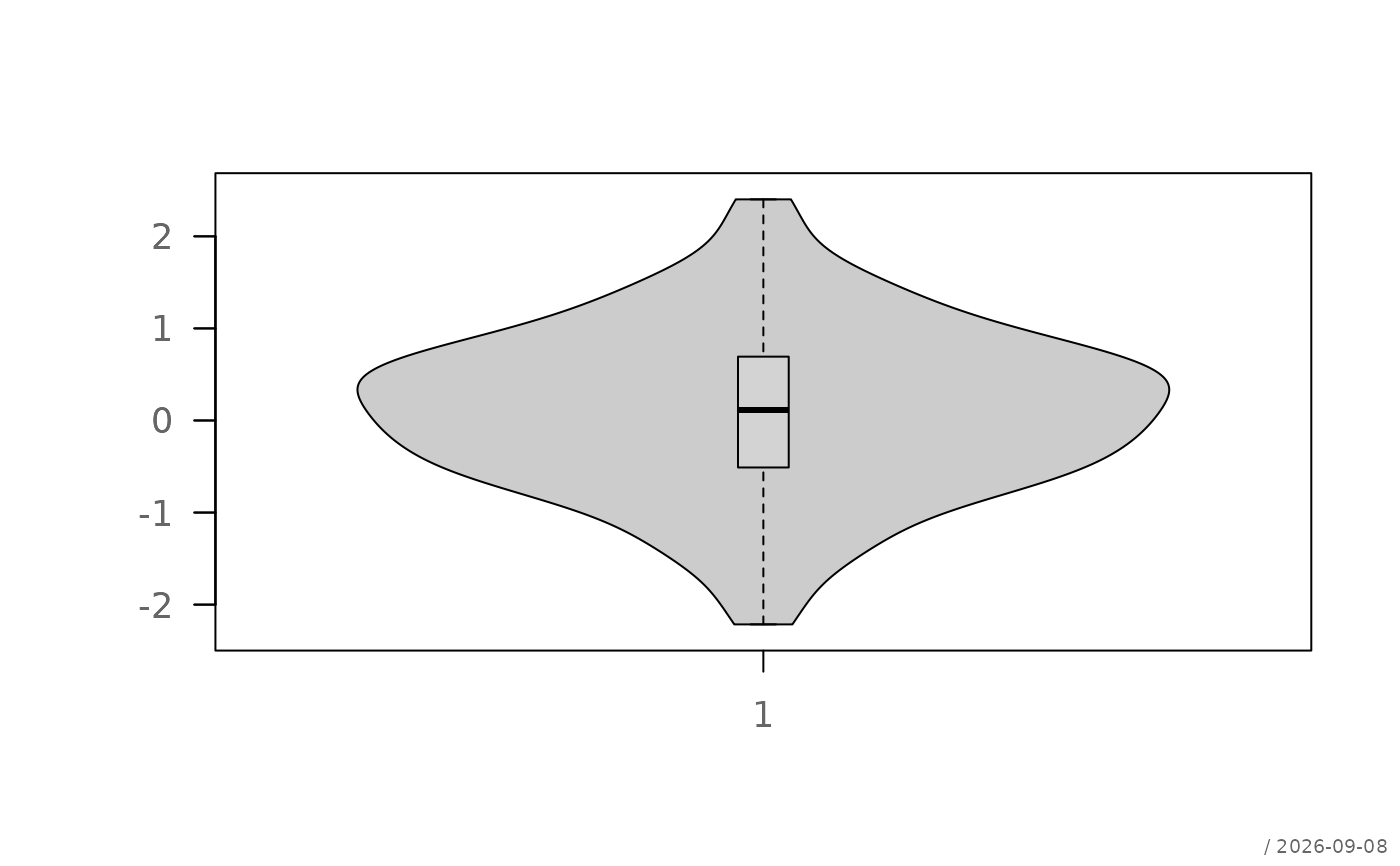
plotViolin(x, y)
 # horizontal violins
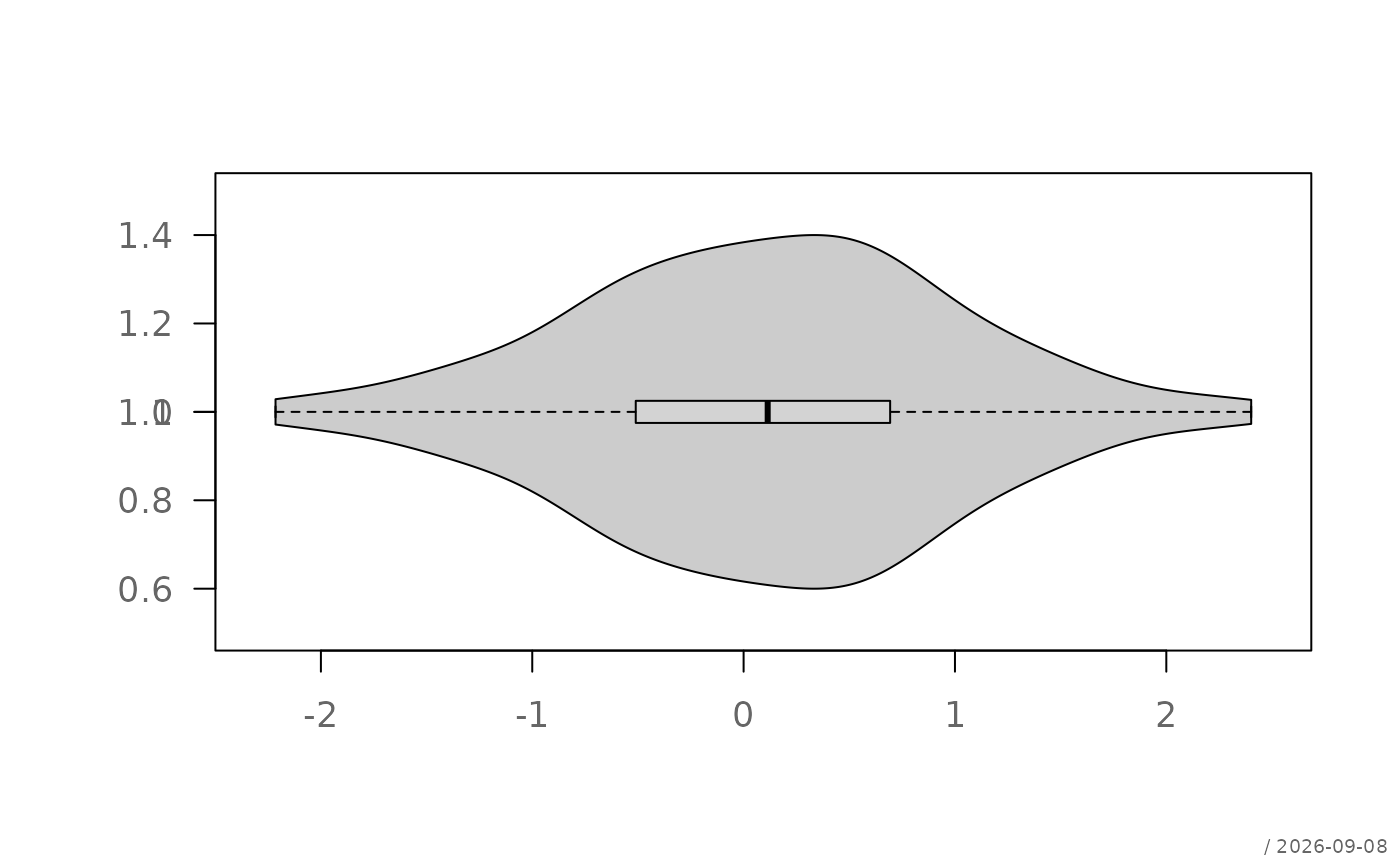
plotViolin(x, y, horiz = TRUE)
# horizontal violins
plotViolin(x, y, horiz = TRUE)
 # with quantiles
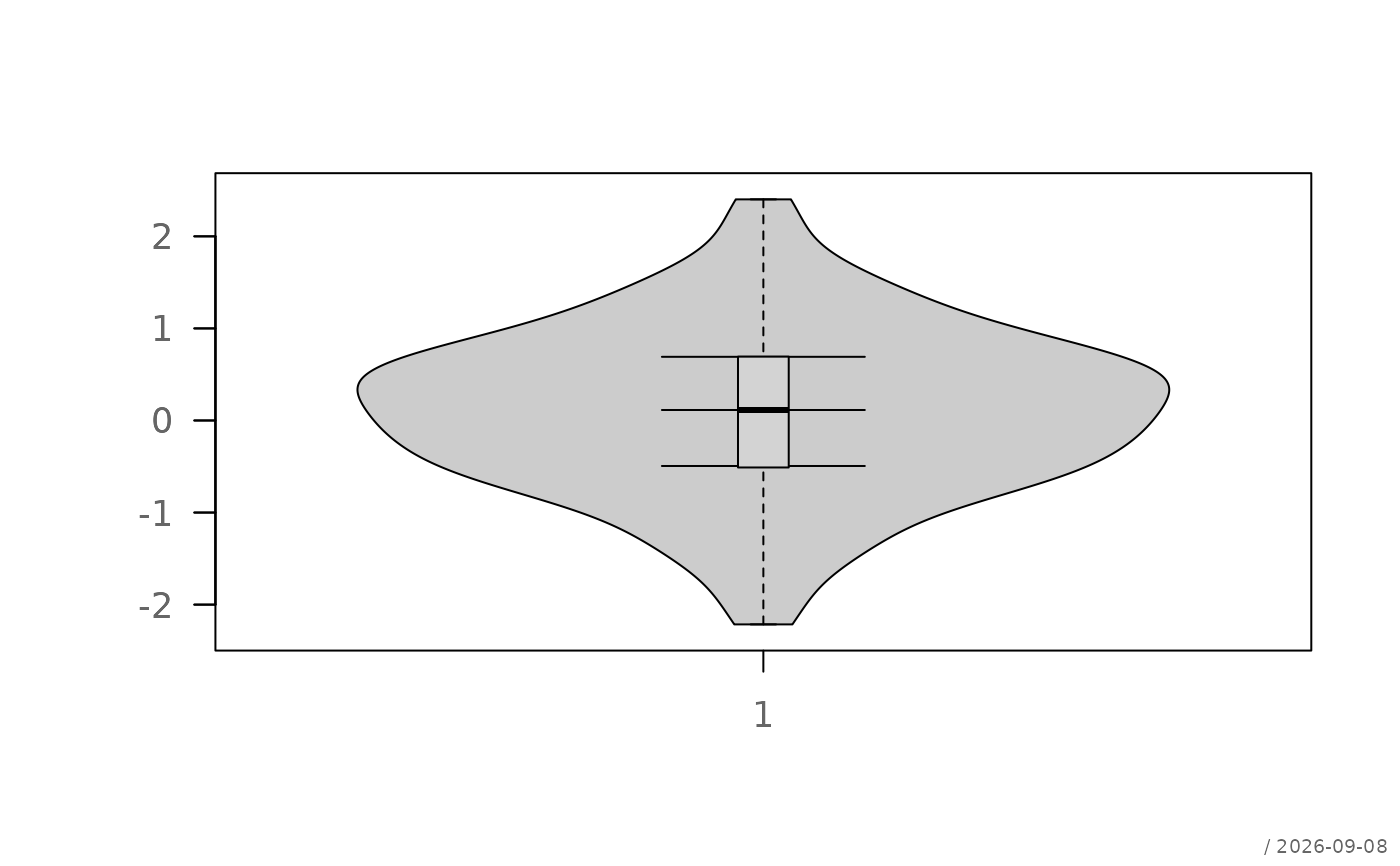
plotViolin(x, y, quantiles = c(0.25, 0.5, 0.75))
# with quantiles
plotViolin(x, y, quantiles = c(0.25, 0.5, 0.75))
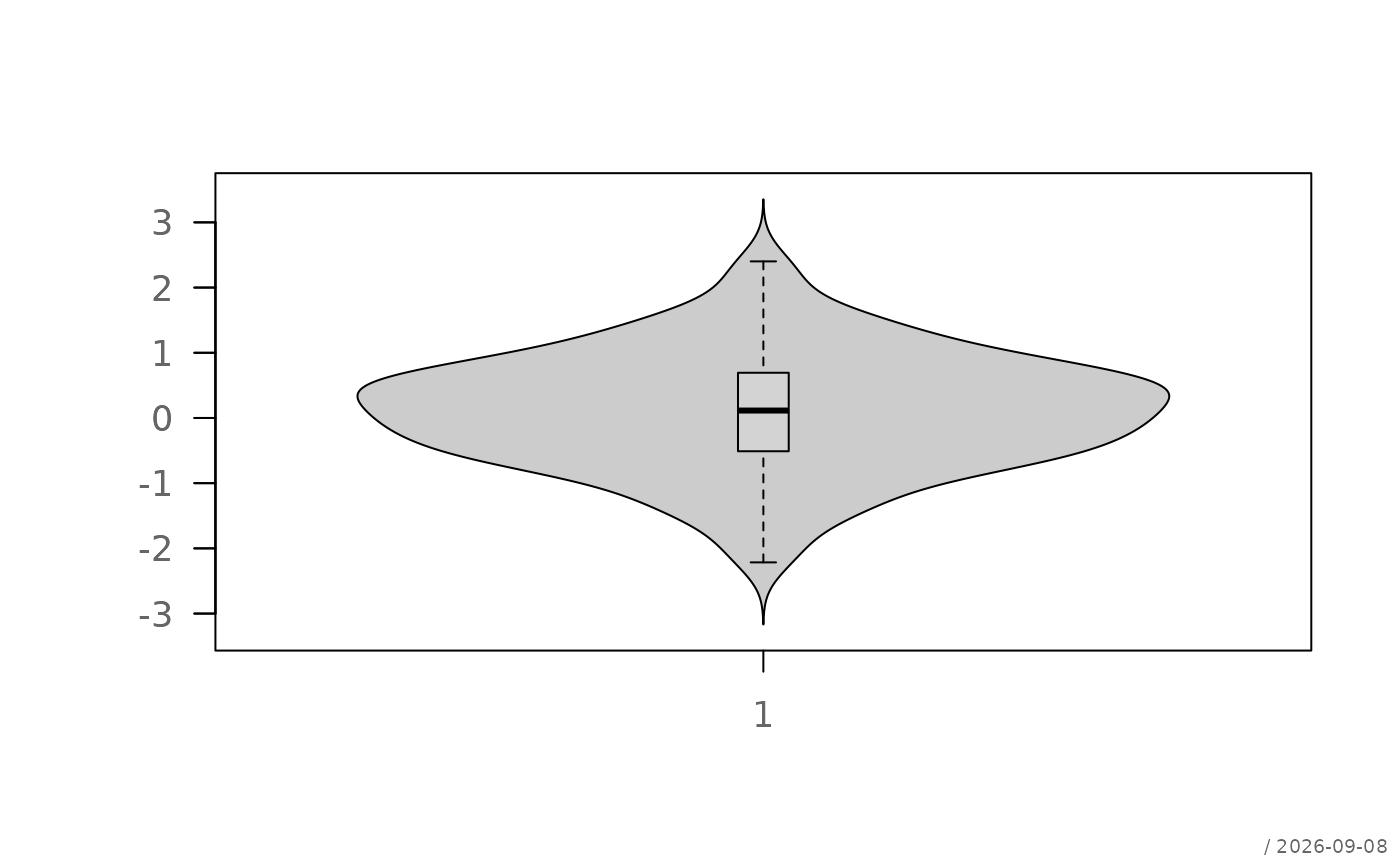
 # untrimmed: tails extend beyond the observed data range
plotViolin(x, y, trim = FALSE)
# untrimmed: tails extend beyond the observed data range
plotViolin(x, y, trim = FALSE)
 # custom styling
plotViolin(x, y,
col = c("lightblue", "salmon"),
box = list(col = "white"),
grid = TRUE
)
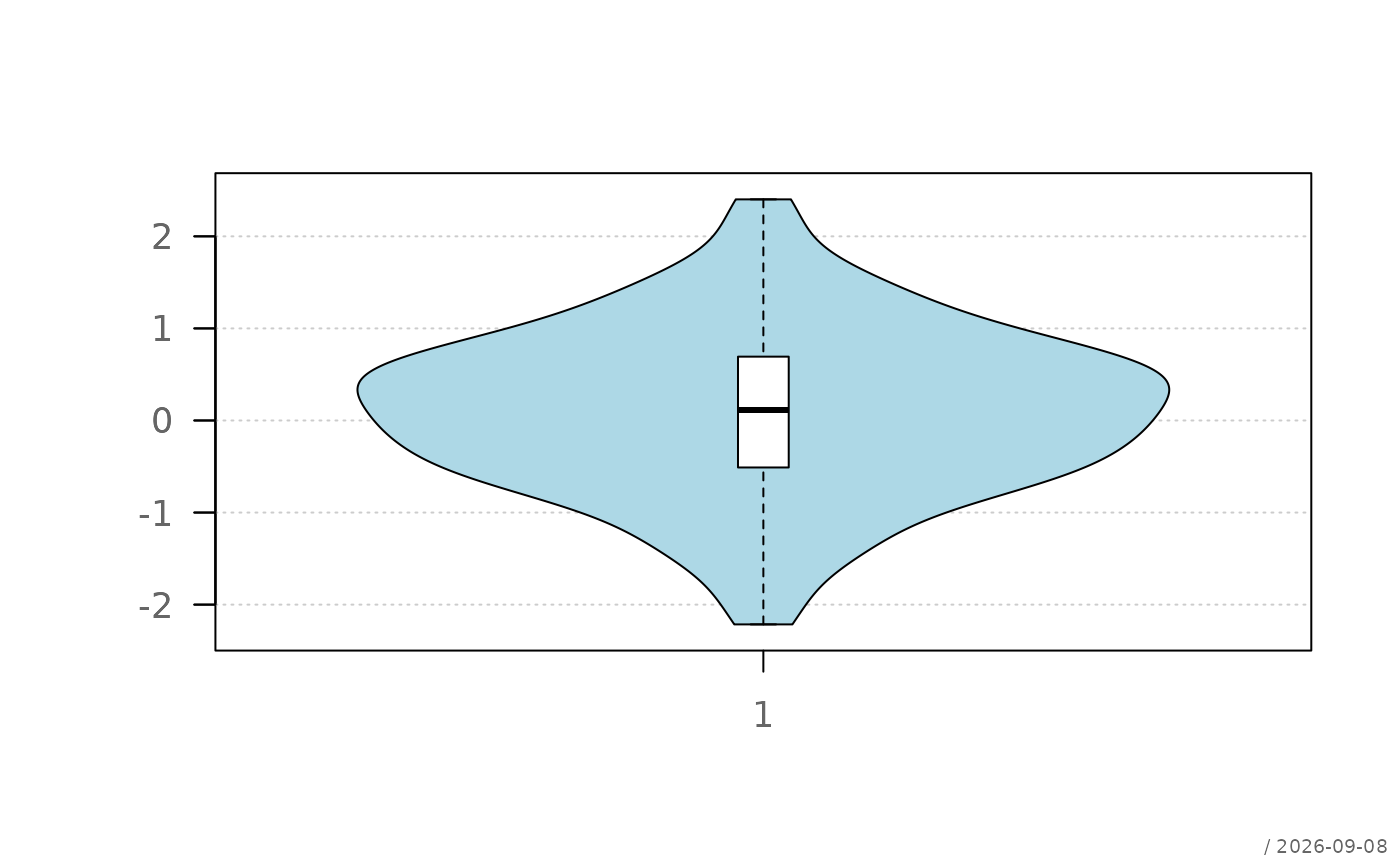
# custom styling
plotViolin(x, y,
col = c("lightblue", "salmon"),
box = list(col = "white"),
grid = TRUE
)
 # formula interface
df <- data.frame(
value = rnorm(200),
group = rep(letters[1:4], each = 50)
)
plotViolin(value ~ group, data = df)
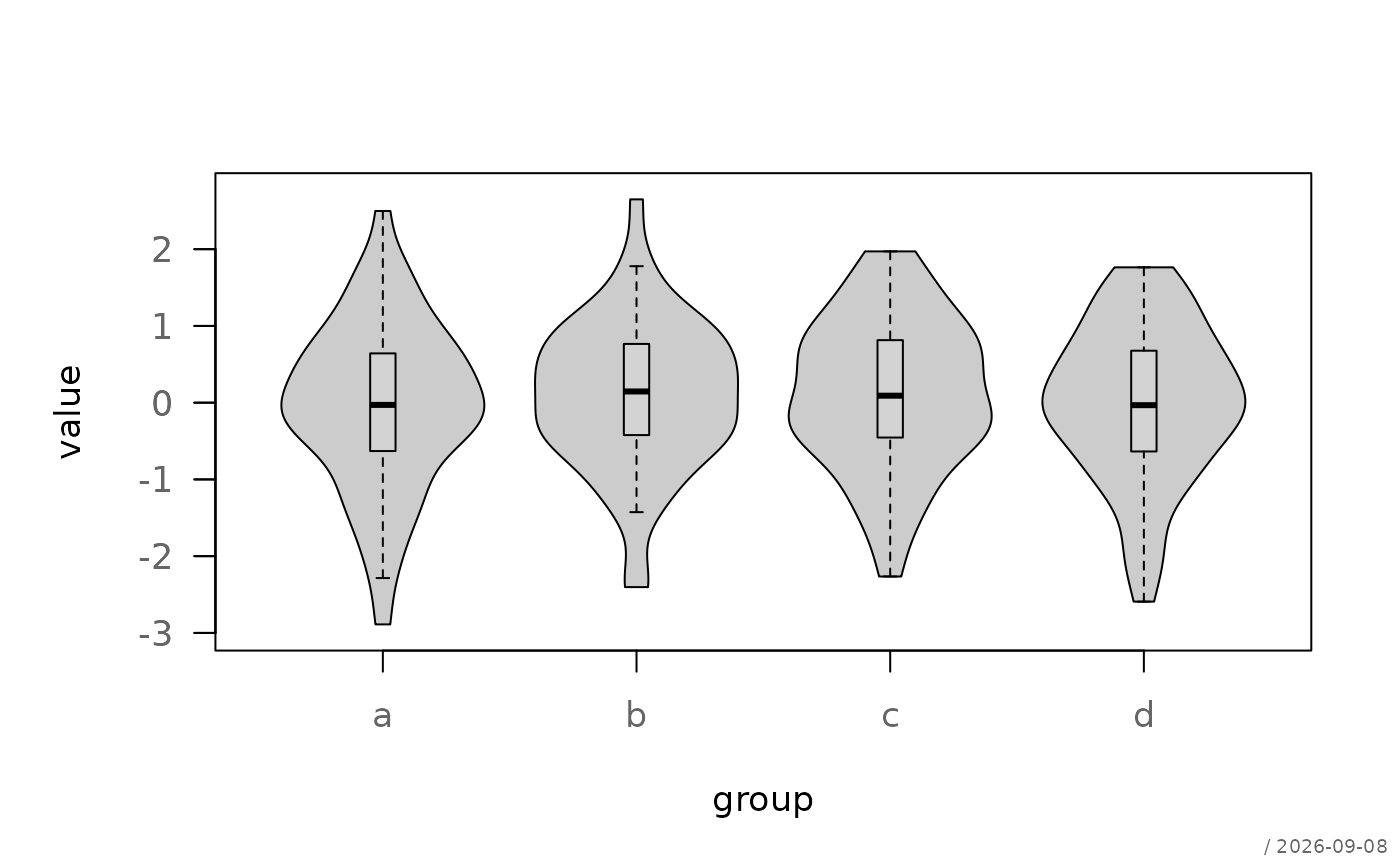
# formula interface
df <- data.frame(
value = rnorm(200),
group = rep(letters[1:4], each = 50)
)
plotViolin(value ~ group, data = df)
 # subset and the cells of two grouping variables
plotViolin(len ~ supp:dose, ToothGrowth, subset = len > 8)
# subset and the cells of two grouping variables
plotViolin(len ~ supp:dose, ToothGrowth, subset = len > 8)