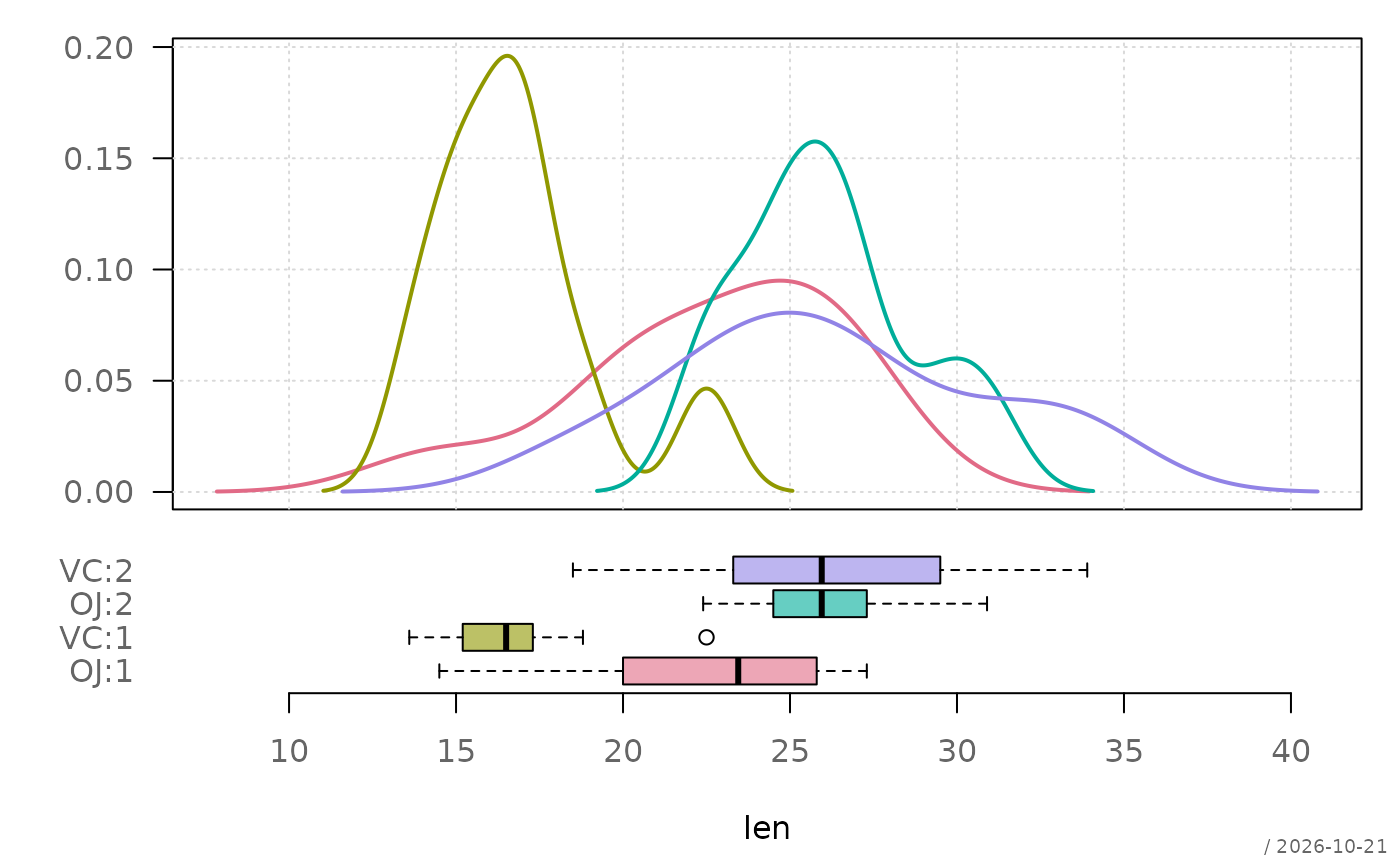
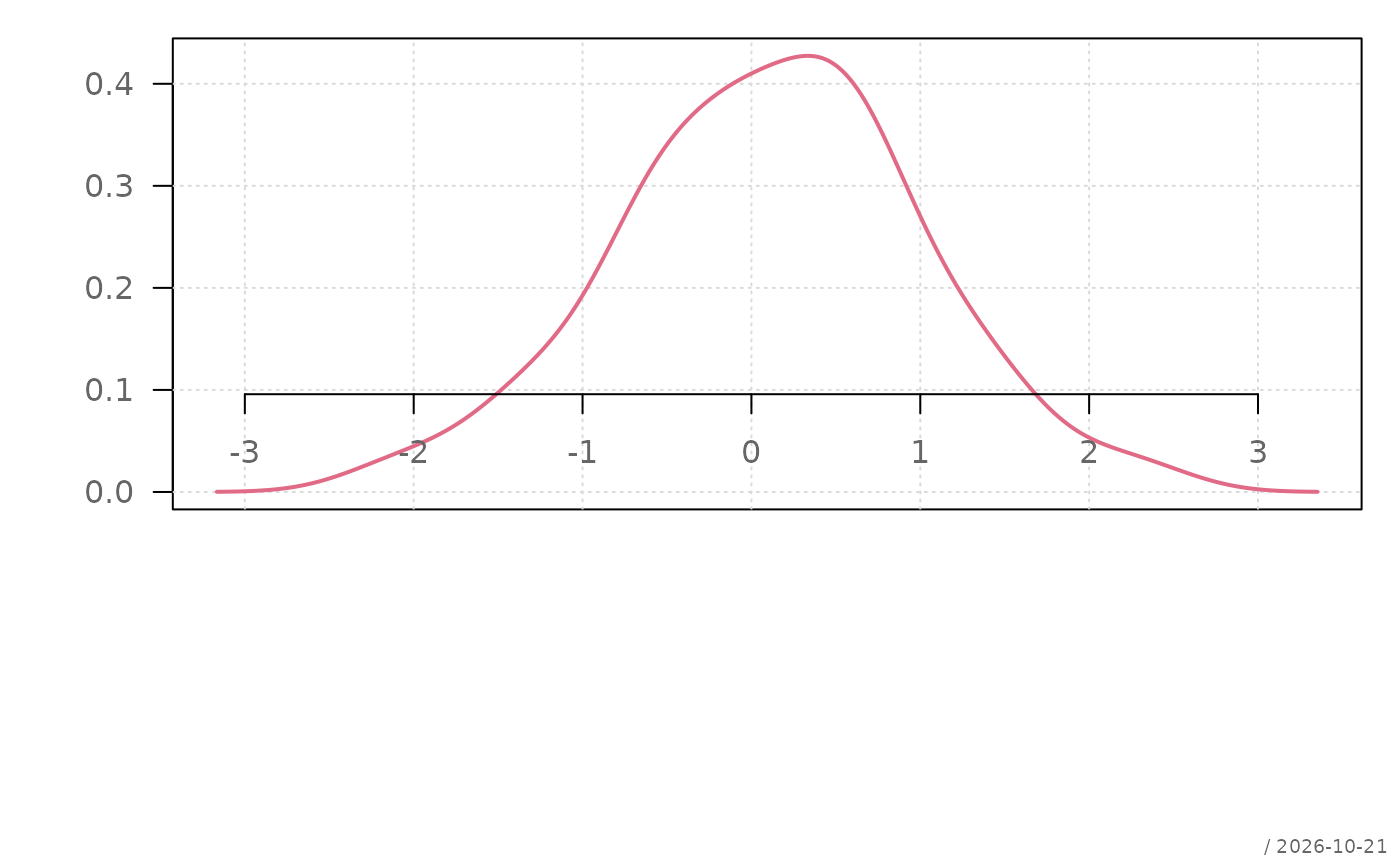
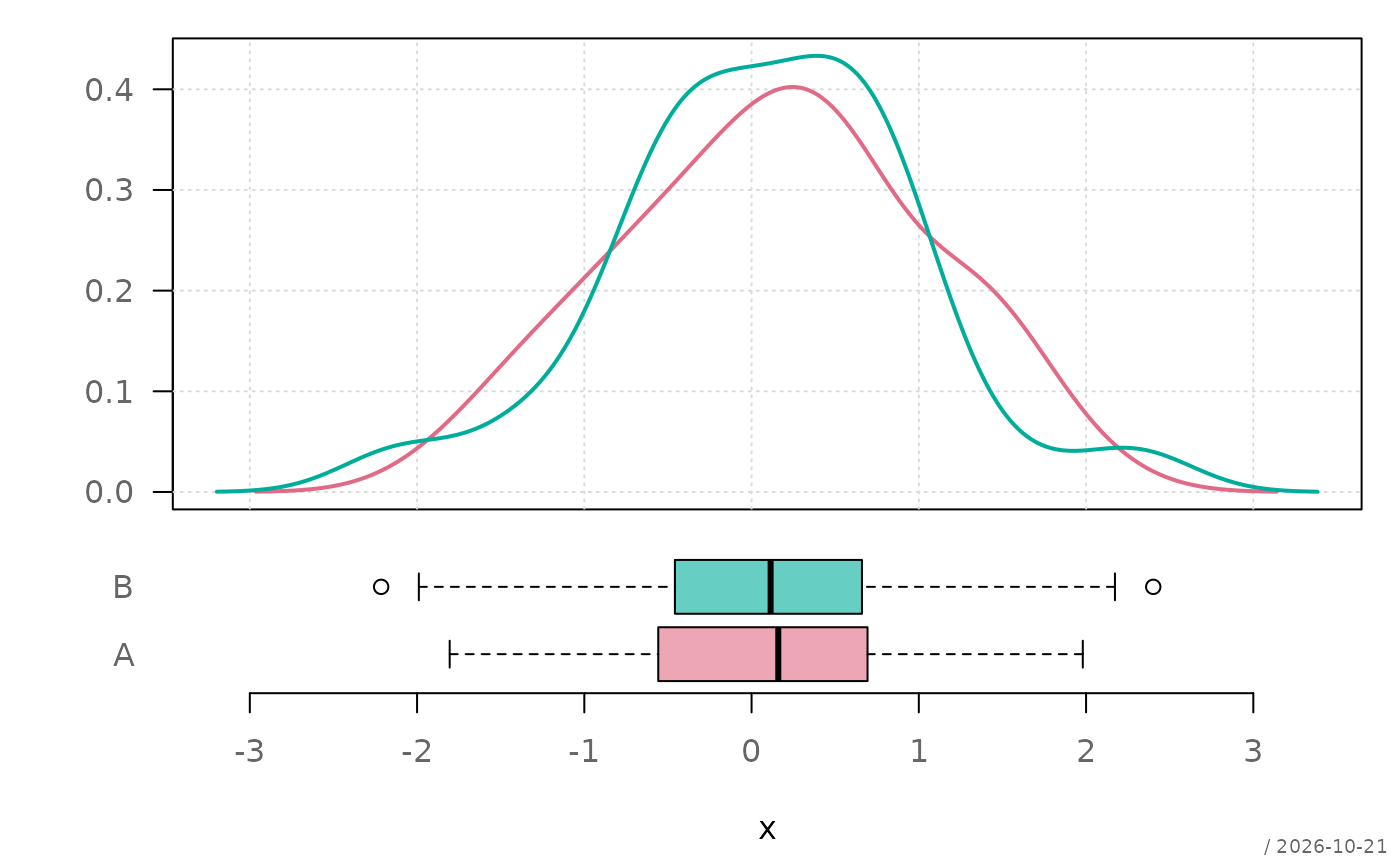
Combines density plots and horizontal boxplots for a numeric variable, optionally grouped by a categorical variable. The density plot shows the distribution shape, while the boxplot summarizes key statistics such as median, spread, and outliers.
Usage
plotDensBox(x, ...)

# Default S3 method
plotDensBox(
  x,
  groups = NULL,
  main = NULL,
  xlab = "",
  ylab = "",
  xlim = NULL,
  heights = c(2, 1.4),
  col = NULL,
  grid = TRUE,
  dens = TRUE,
  box = TRUE,
  stamp = .useTheme,
  ...
)

# S3 method for class 'formula'
plotDensBox(
  formula,
  data,
  subset,
  na.action = na.omit,
  main = NULL,
  xlab = "",
  ...
)
Arguments
- x
numeric vector, or a formula of the form
x ~ g.- ...
further graphical parameters passed to
graphics::par()via the internal framework.- groups
optional grouping variable (ignored if a formula is used).
- main
main title.
NULL(default) draws none, unless the theme setsautoTitle = TRUE(see theme); the title is then derived from the input: the formula, orxresp.x ~ gfor the default method."",NAorFALSEalways suppress it and remove its outer margin; any other string is used as given.- xlab
label for the x-axis, drawn below the boxplot. For the formula method, an empty label defaults to the response.
- ylab
label for the y-axis of the density panel.
- xlim
numeric vector of length 2 specifying the x-axis limits.
NULL(default) covers the data and the tails of the densities.- heights
numeric vector of length 2 specifying the relative heights of the density plot (top) and boxplot (bottom).
- col
vector of colors, recycled over the groups. If
NULL, a palette is generated.- grid
controls drawing of the background grid. Can be:
TRUE: draw grid with default settingsFALSE,NULL,NA: suppress grida named list: arguments passed to
graphics::grid()
- dens
controls density estimation via
stats::density(). Can be:TRUE: use default density settingsFALSE,NULL,NA: suppress densitiesa named list: additional arguments passed to
stats::density()
- box
controls drawing of boxplots via
graphics::boxplot(). Can be:TRUE: use default boxplot settingsFALSE,NULL,NA: suppress boxplotsa named list: additional arguments passed to
graphics::boxplot()
- stamp
controls the corner stamp.
.useTheme(default) resolves togetTheme()$stamp.TRUE/FALSE/NULL, a string, or a named list forstamp().- formula
a formula of the form
y ~ group, ory ~ a:bfor the cells of several grouping variables.y ~ a + bis not accepted, seebedrock::resolveFormula().- data
an optional data frame containing the variables in the formula.
- subset
an optional expression indicating which observations to use, evaluated in
data(subset = len > 10), as inboxplot().- na.action
a function specifying how missing values are handled, defaults to
na.omit().
Details
The function arranges two plots vertically using layout():
a density plot on top and a horizontal boxplot below. When a grouping
variable is provided, densities and boxplots are drawn for each group.
Optional plot components are controlled using
bedrock::callIf() semantics:
TRUE: draw with defaultsFALSE: suppress componentnamed list: customize component arguments
See also
stats::density(),
graphics::boxplot(),
bedrock::callIf()
Other plot.univariate:
plotArea(),
plotBar(),
plotBox(),
plotCatDist(),
plotDens(),
plotDot(),
plotECDF(),
plotFreqDist(),
plotLines(),
plotQQ(),
plotViolin()
Examples
set.seed(1)
x <- rnorm(100)
g <- sample(c("A", "B"), 100, TRUE)
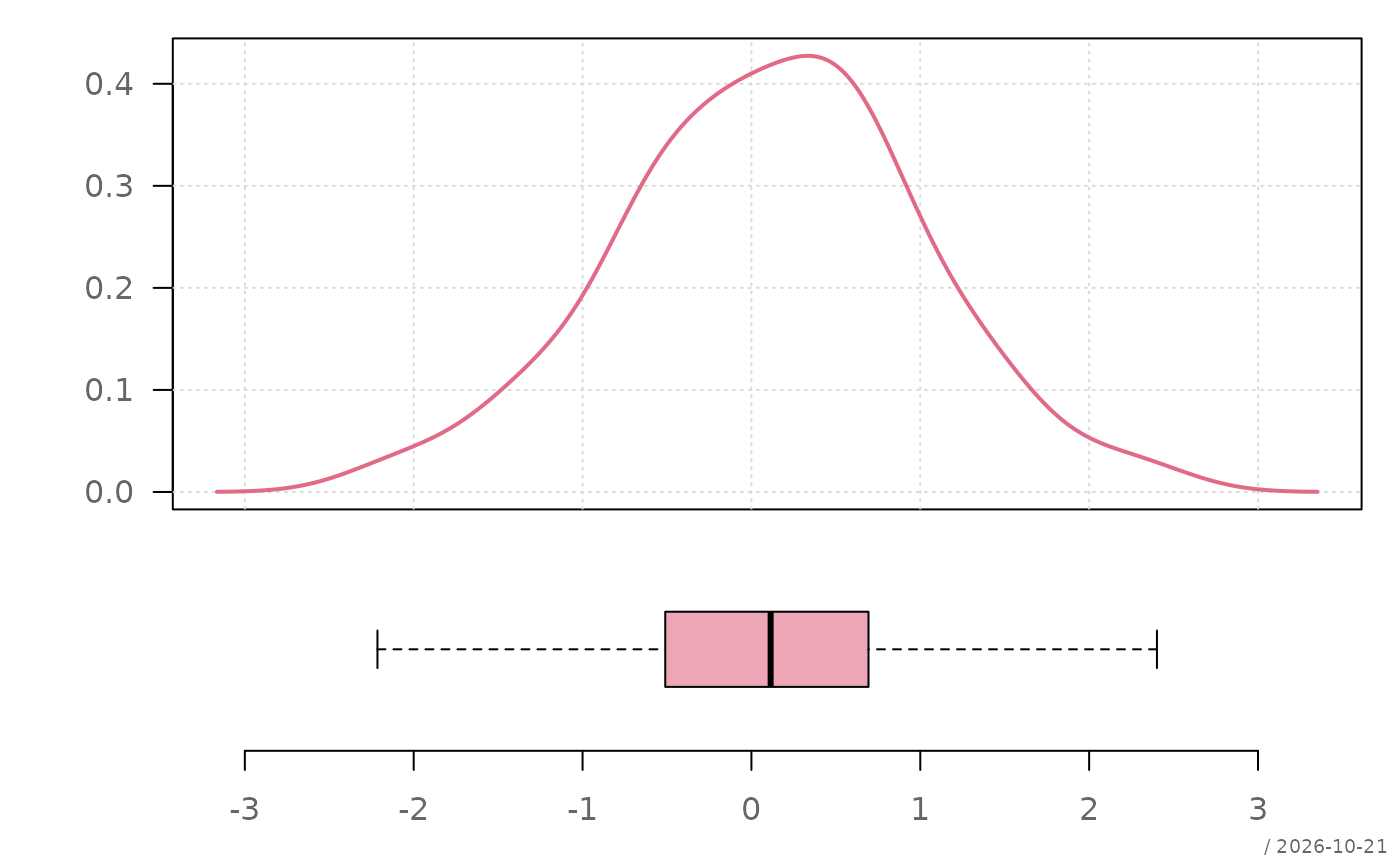
plotDensBox(x)
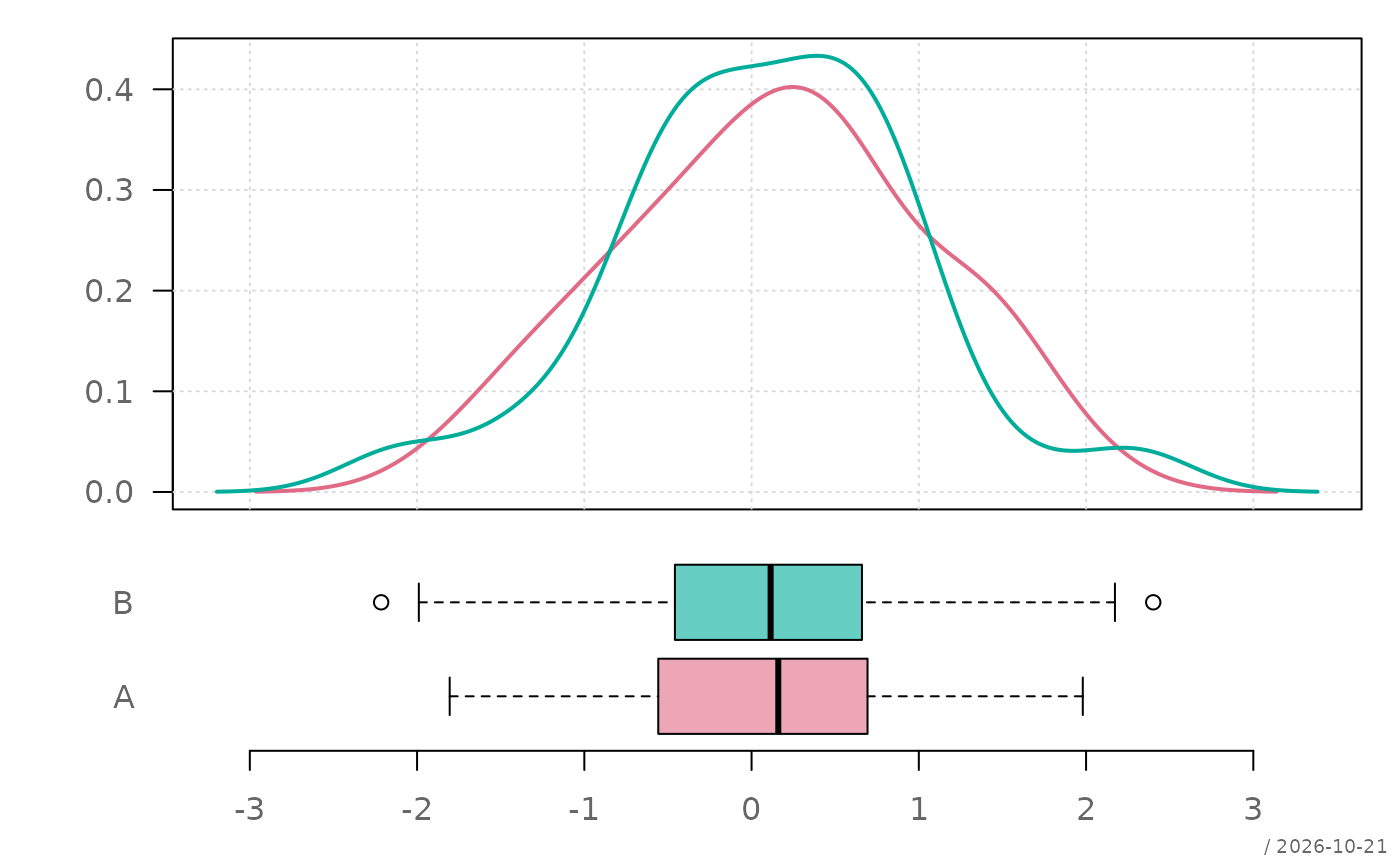
 plotDensBox(x, g)
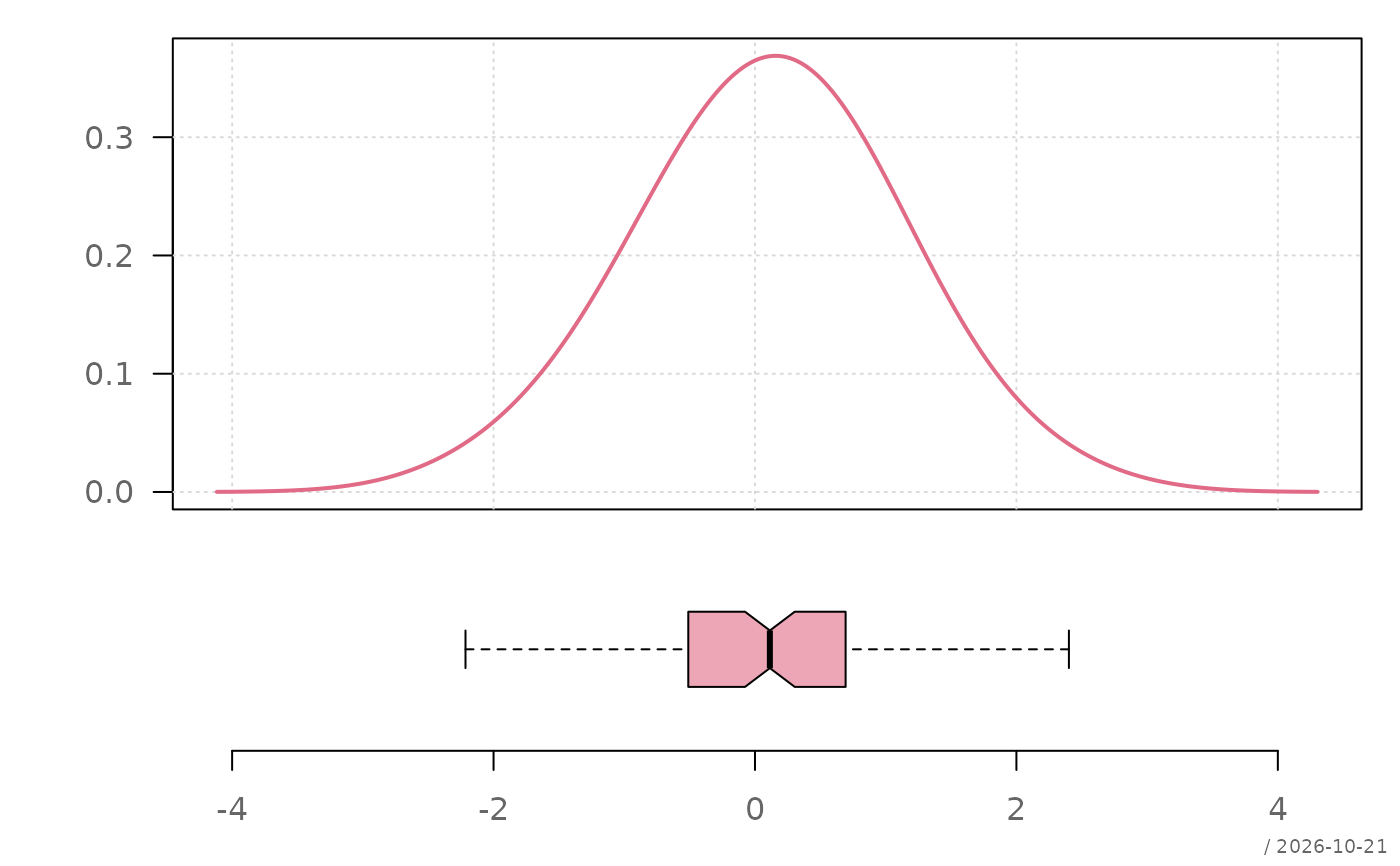
 plotDensBox(
x,
dens = list(adjust = 2),
box = list(notch = TRUE)
)
plotDensBox(
x,
dens = list(adjust = 2),
box = list(notch = TRUE)
)
 plotDensBox(
x,
box = FALSE
)
plotDensBox(
x,
box = FALSE
)
 plotDensBox(x ~ g)
 # subset and the cells of two grouping variables
plotDensBox(len ~ supp:dose, ToothGrowth, subset = dose > 0.5)
# subset and the cells of two grouping variables
plotDensBox(len ~ supp:dose, ToothGrowth, subset = dose > 0.5)