Creates a themed wrapper around graphics::barplot() with
support for consistent styling, optional grid lines, value labels,
and connecting lines for stacked barplots.
Usage
plotBar(
  height,
  main = NULL,
  xlab = NULL,
  ylab = NULL,
  yax = NULL,
  beside = FALSE,
  horiz = FALSE,
  col = .useTheme,
  border = .useTheme,
  grid = .useTheme,
  box = FALSE,
  text = NULL,
  legend = TRUE,
  connLines = NULL,
  stamp = .useTheme,
  ...
)
Arguments
- height
A vector or matrix of bar heights passed directly to
graphics::barplot().- main
main title.
NULL(default) draws none."",NAorFALSEalso suppress it; the top margin is compacted whenever no title is drawn.- xlab, ylab
optional axis labels. Defaults follow base graphics behaviour.
- yax
controls drawing of the numeric axis.
Supported values are
TRUEdraw axis using package defaults
FALSEsuppress axis
NULLdo not draw a numeric axis at all
list(...)custom axis parameters passed to the axis drawing routine
- beside
logical. If
TRUE, bars are drawn side-by-side. IfFALSE(default), bars are stacked.- horiz
logical. If
TRUE, bars are drawn horizontally. Defaults toFALSE.- col
bar fill colours.
.useTheme(default) resolves togetTheme()$bar$colfor a vector. For a matrix with several rows, whose rows are the segments (stacked) or the bars within a group (beside = TRUE), it becomes a ramp from a dark to a light shade of that color, one per row, so the rows can be told apart.- border
bar border colour.
.useTheme(default) resolves togetTheme()$bar$border.- grid
controls drawing of grid lines. Can be:
.useTheme(default): follow the active theme (getTheme()$grid), restricted to the axis perpendicular to the value axis (e.g. horizontal lines only for vertical bars)TRUE: draw grid with theme settingsFALSE,NULL, orNA: suppress grida named list: arguments passed to
graphics::grid(), overriding the theme/function defaults for this call only
- box
controls drawing of the plot box.
.useTheme(default) resolves togetTheme()$box.TRUE/FALSE/NA, or a named list, as forgrid.- text
optional list of arguments passed to
barText()to draw value labels on bars.- legend
controls the legend explaining the rows of a matrix.
TRUE(default) draws one wheneverheightis a matrix with several named rows; it is placed in the right margin, which is widened for it unlessmarin...sets the right side.FALSE,NULLorNAsuppress it. A named list overrides arguments ofgraphics::legend(); givingxthere places the legend inside the plot instead (e.g.list(x = "topleft")). Not drawn whenlegend.textis passed on tographics::barplot().- connLines
optional list of arguments controlling connecting lines between stacked bars. Only supported when
beside = FALSE.- stamp
controls the corner stamp.
.useTheme(default) resolves togetTheme()$stamp.TRUE/FALSE/NULL, or an explicit string, as for.withGraphicsState()(internal).- ...
additional arguments passed to
graphics::barplot()and graphical parameters (viagraphics::par()).
Value
Invisibly returns the midpoints of the bars as returned by
graphics::barplot().
Details
The function first initializes the plotting region invisibly using
graphics::barplot(), optionally adds grid lines, and then
draws the actual bars and additional layers (axis, connecting lines,
text labels).
The function internally performs the following steps:
Draws an invisible
barplotto establish the coordinate system.Optionally adds grid lines.
Draws the bars.
Draws the numeric axis if enabled.
Optionally adds connecting lines for stacked bars.
Optionally adds value labels via
barText().Optionally draws a box around the plot region.
Graphical parameters such as bg, cex, las,
mar, etc. can be supplied via ....
The precedence of theme-aware settings (col, border,
grid, box, stamp) is
explicit argument > function-specific default > active theme (getTheme())
See also
graphics::barplot, barText, theme
Other plot.univariate:
plotArea(),
plotBox(),
plotCatDist(),
plotDens(),
plotDensBox(),
plotDot(),
plotECDF(),
plotFreqDist(),
plotLines(),
plotQQ(),
plotViolin()
Examples
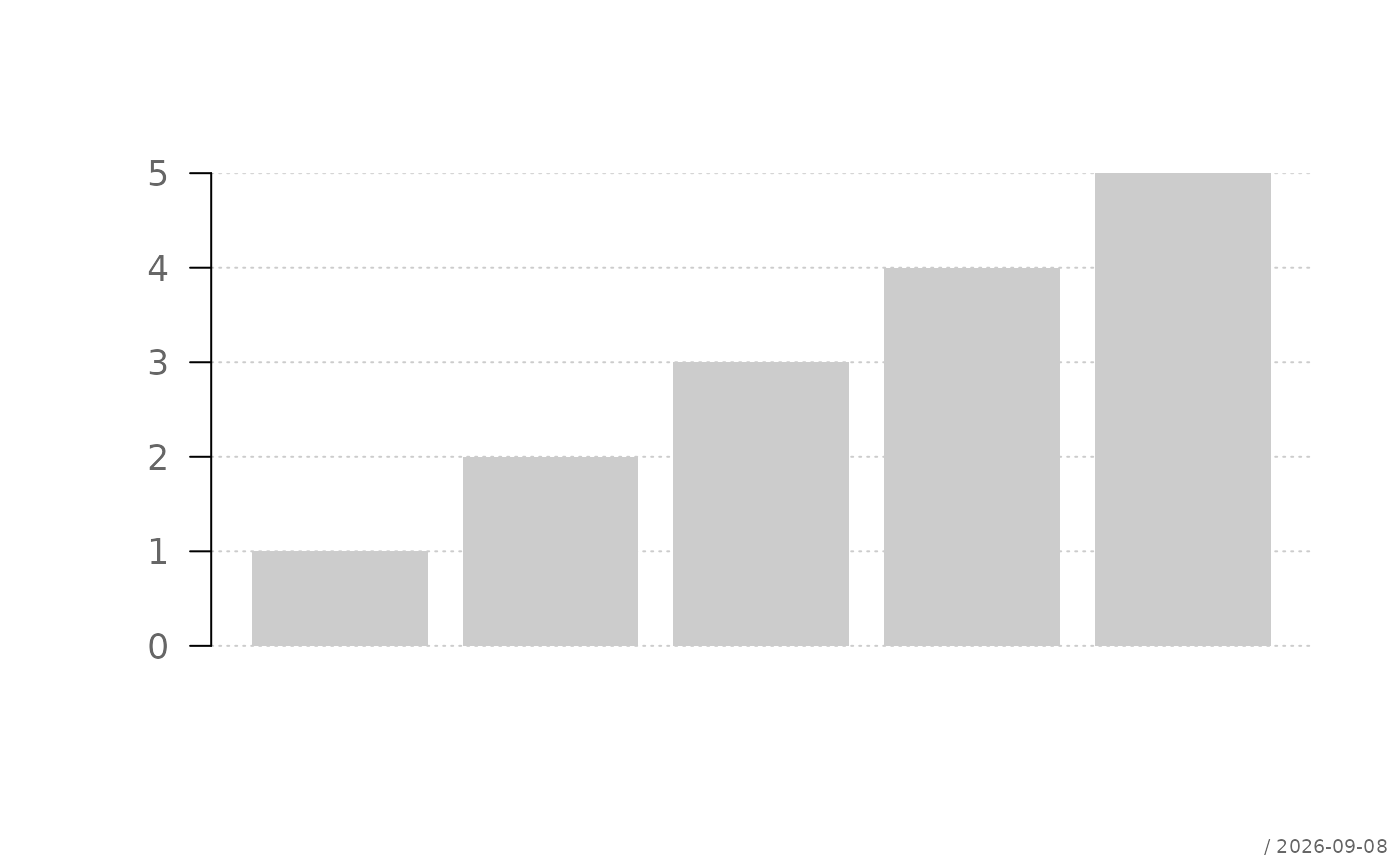
# Simple barplot
plotBar(1:5)
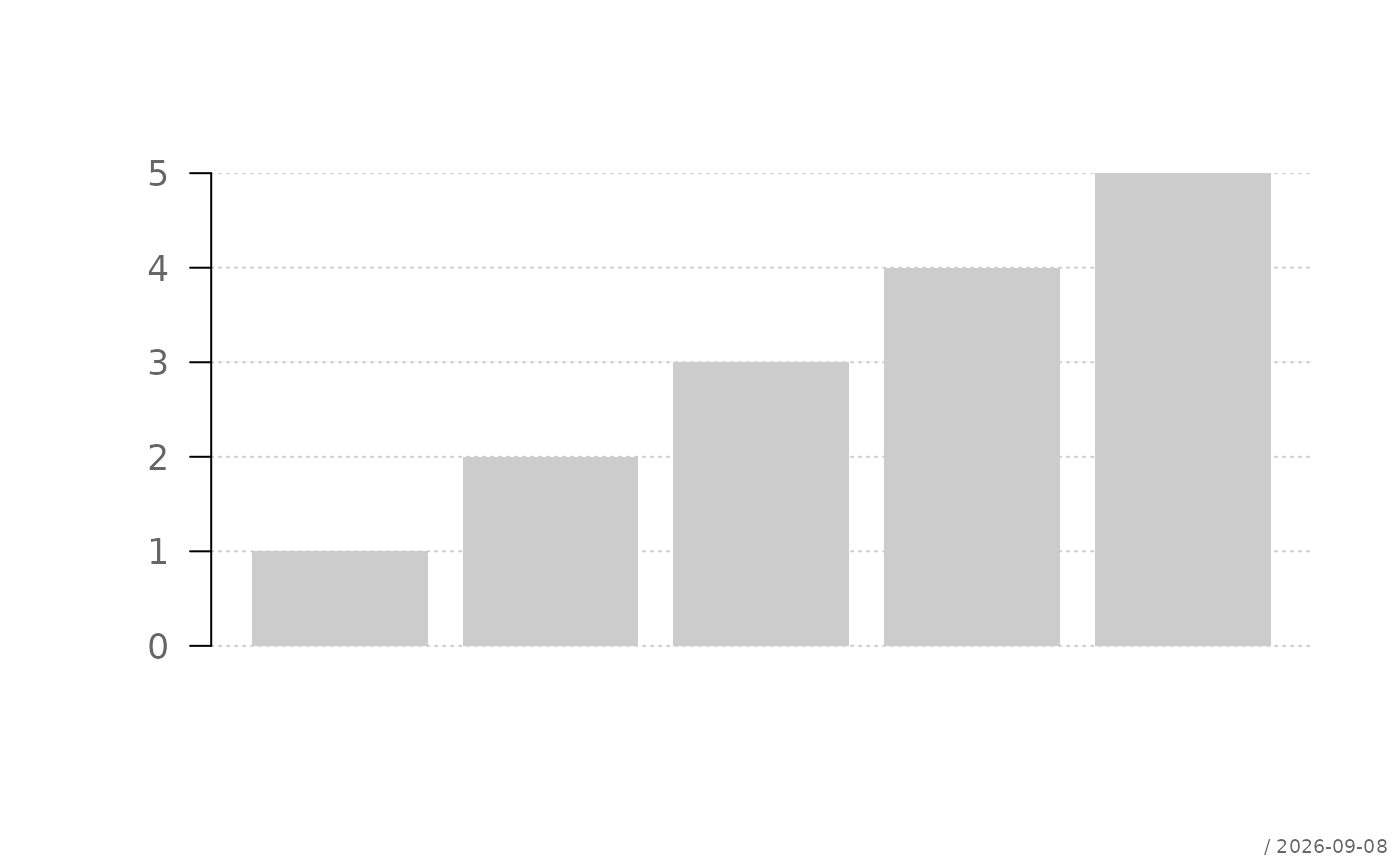
 # With grid lines
plotBar(1:5, grid = TRUE)
# With grid lines
plotBar(1:5, grid = TRUE)
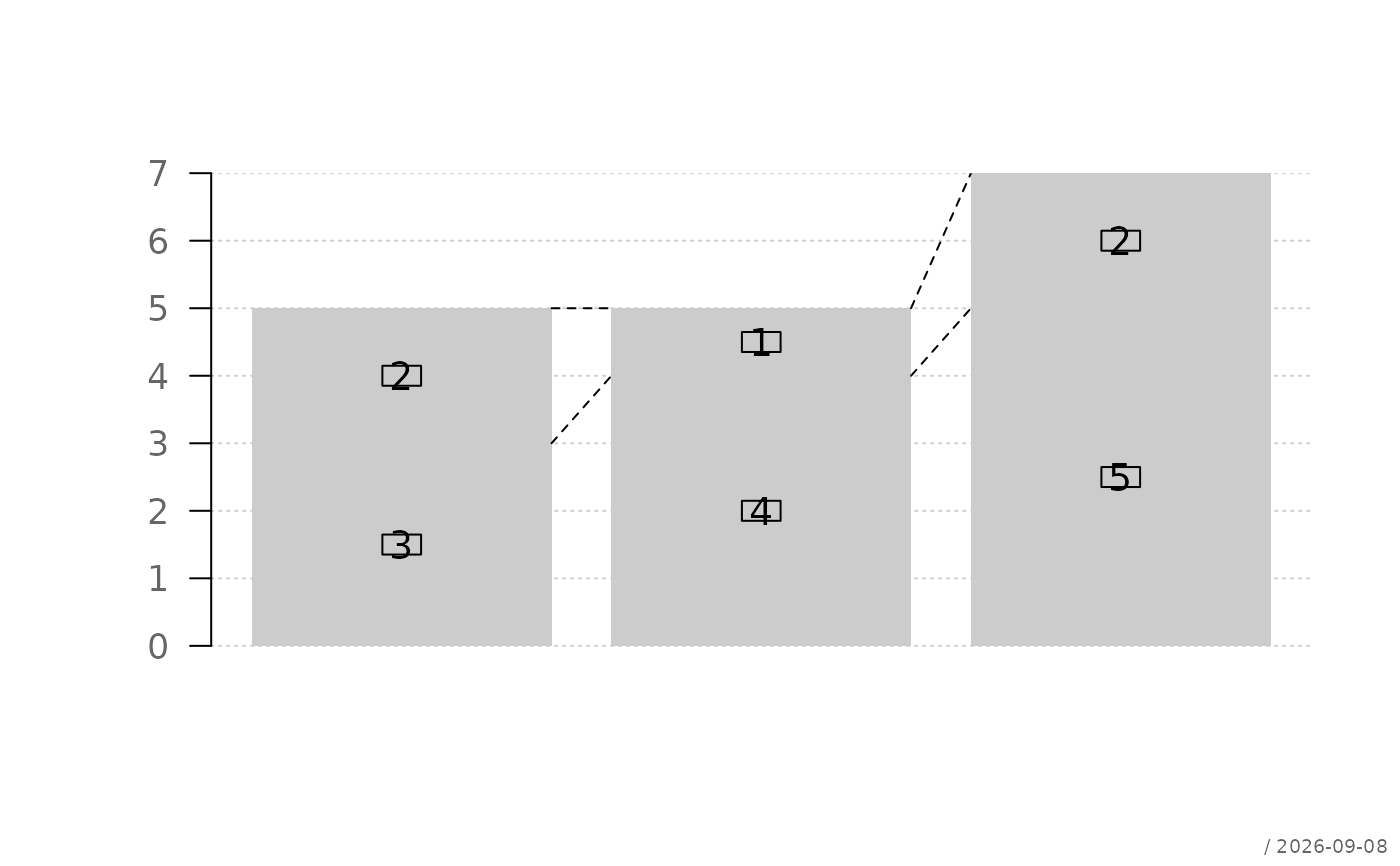
 # Stacked bars with labels and connecting lines
m <- matrix(c(3,2,4,1,5,2), nrow = 2)
plotBar(m,
text = list(pos = "mid"),
connLines = list(col = "black"))
# Stacked bars with labels and connecting lines
m <- matrix(c(3,2,4,1,5,2), nrow = 2)
plotBar(m,
text = list(pos = "mid"),
connLines = list(col = "black"))
 # a matrix: one shade per row, with a legend
plotBar(VADeaths)
# a matrix: one shade per row, with a legend
plotBar(VADeaths)
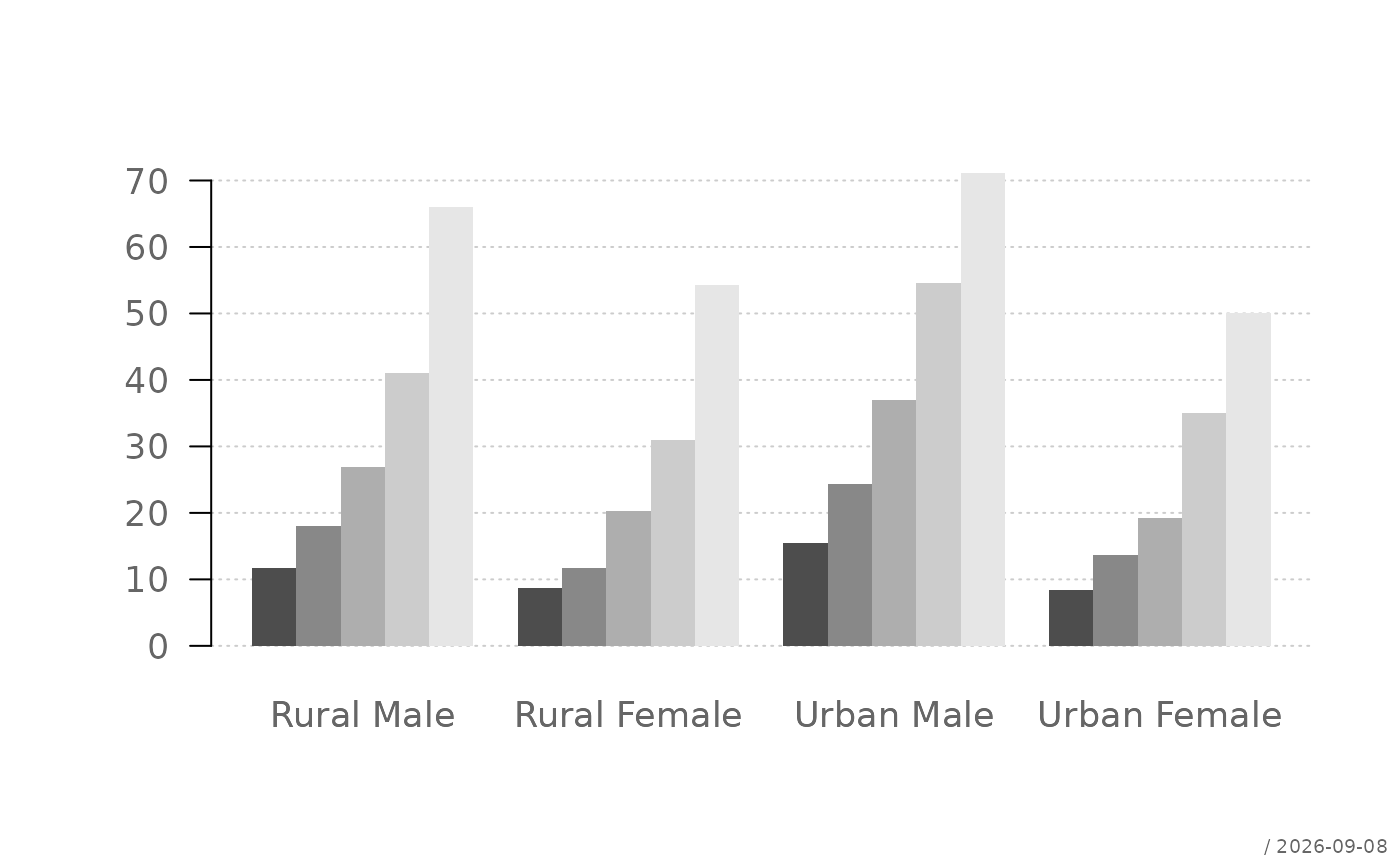 # Grouped bars
plotBar(VADeaths,
beside = TRUE,
col = gray.colors(nrow(VADeaths)))
# Grouped bars
plotBar(VADeaths,
beside = TRUE,
col = gray.colors(nrow(VADeaths)))
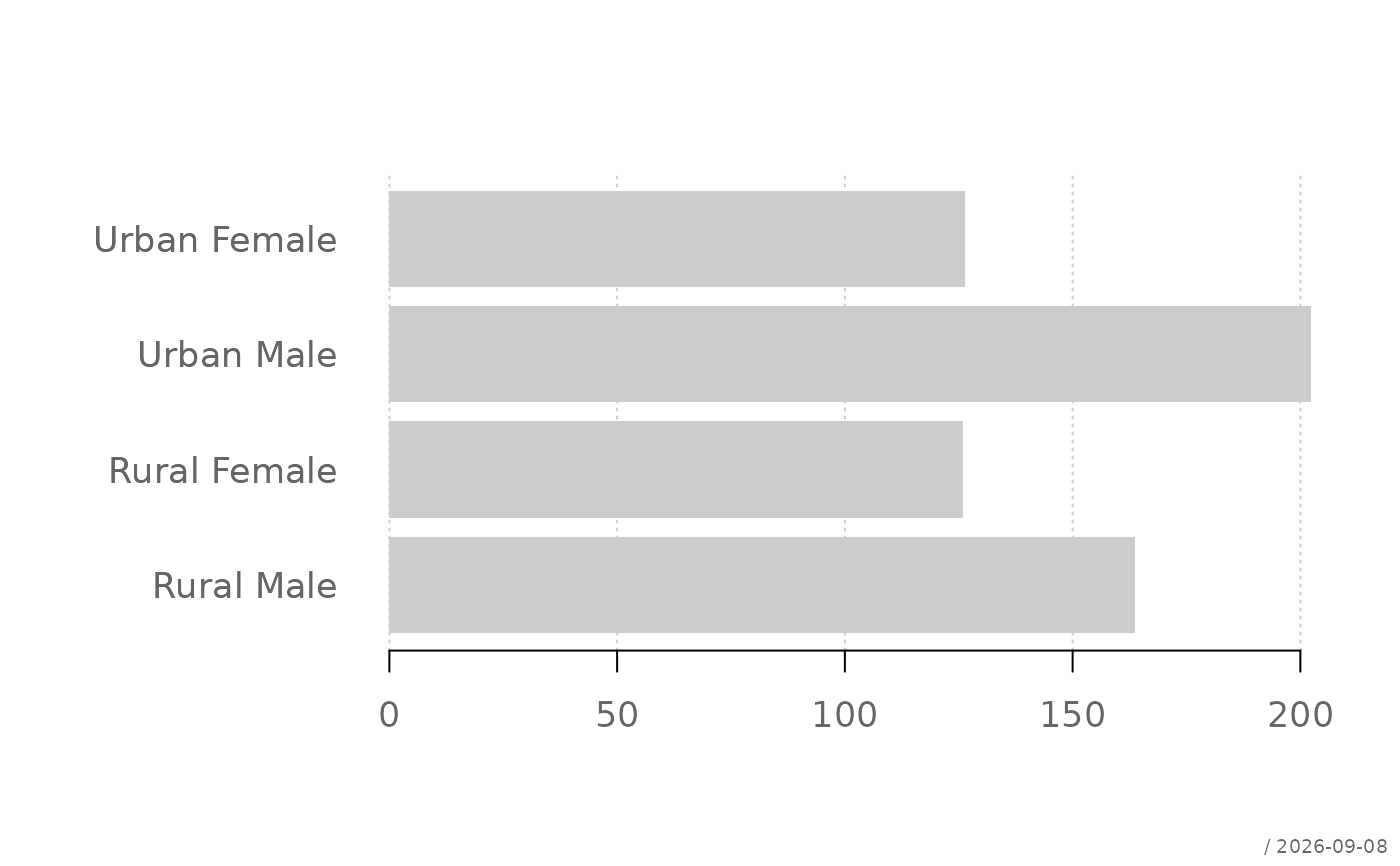 # Horizontal bars
plotBar(VADeaths,
horiz = TRUE,
las = 1)
# Horizontal bars
plotBar(VADeaths,
horiz = TRUE,
las = 1)
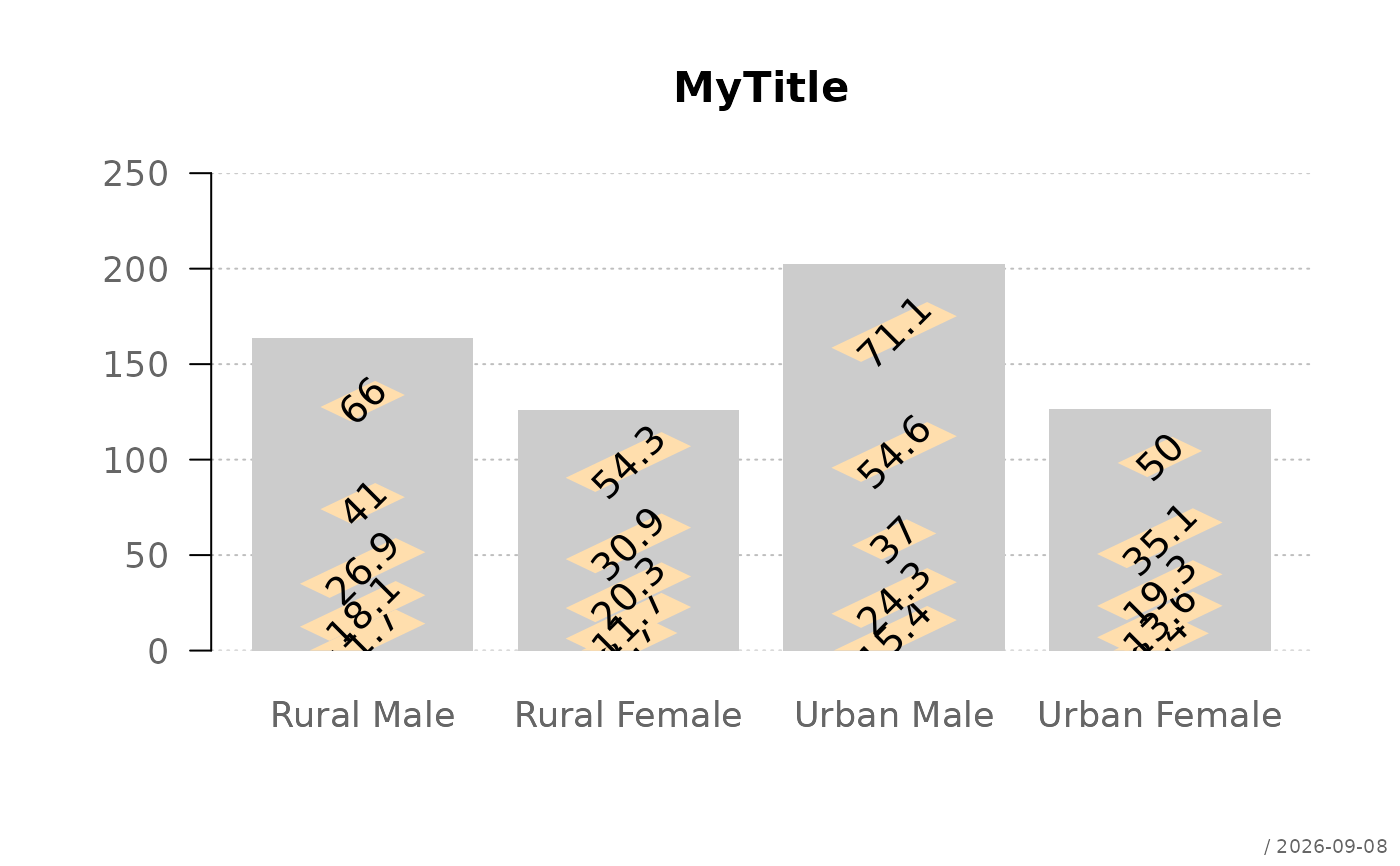 plotBar(VADeaths, ylim=c(0,250),
grid=list(col = "grey", lty="dotted"),
las=1, main="MyTitle",
text = list(labels=VADeaths,
border = NA, srt=45, bg="navajowhite"))
plotBar(VADeaths, ylim=c(0,250),
grid=list(col = "grey", lty="dotted"),
las=1, main="MyTitle",
text = list(labels=VADeaths,
border = NA, srt=45, bg="navajowhite"))
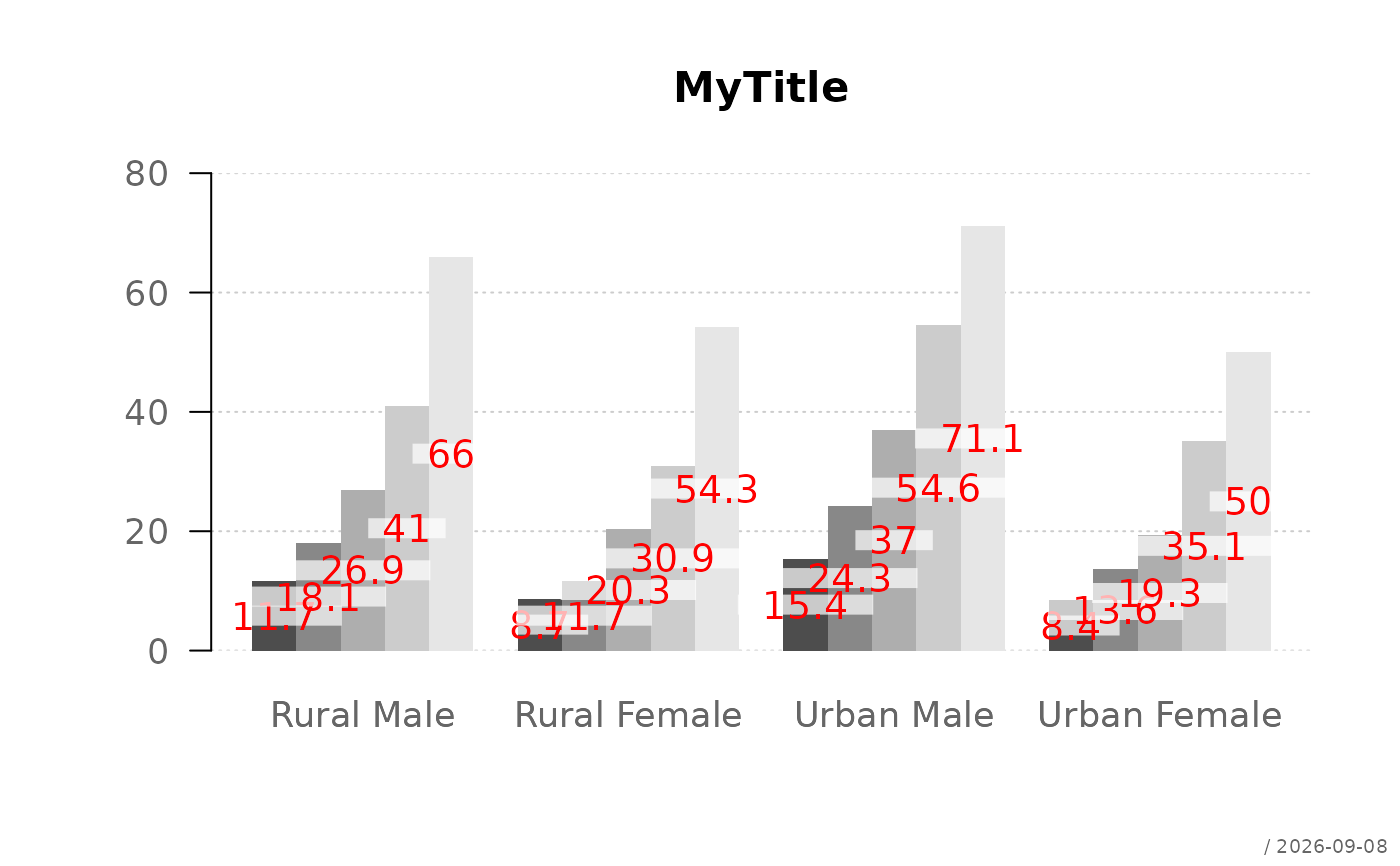 plotBar(VADeaths, ylim=c(0,80),
las=1, main="MyTitle",
box=FALSE,
col=gray.colors(nrow(VADeaths)),
beside=TRUE,
text = list(col="red", bg=addOpacity("white", 0.7), border=NA))
plotBar(VADeaths, ylim=c(0,80),
las=1, main="MyTitle",
box=FALSE,
col=gray.colors(nrow(VADeaths)),
beside=TRUE,
text = list(col="red", bg=addOpacity("white", 0.7), border=NA))
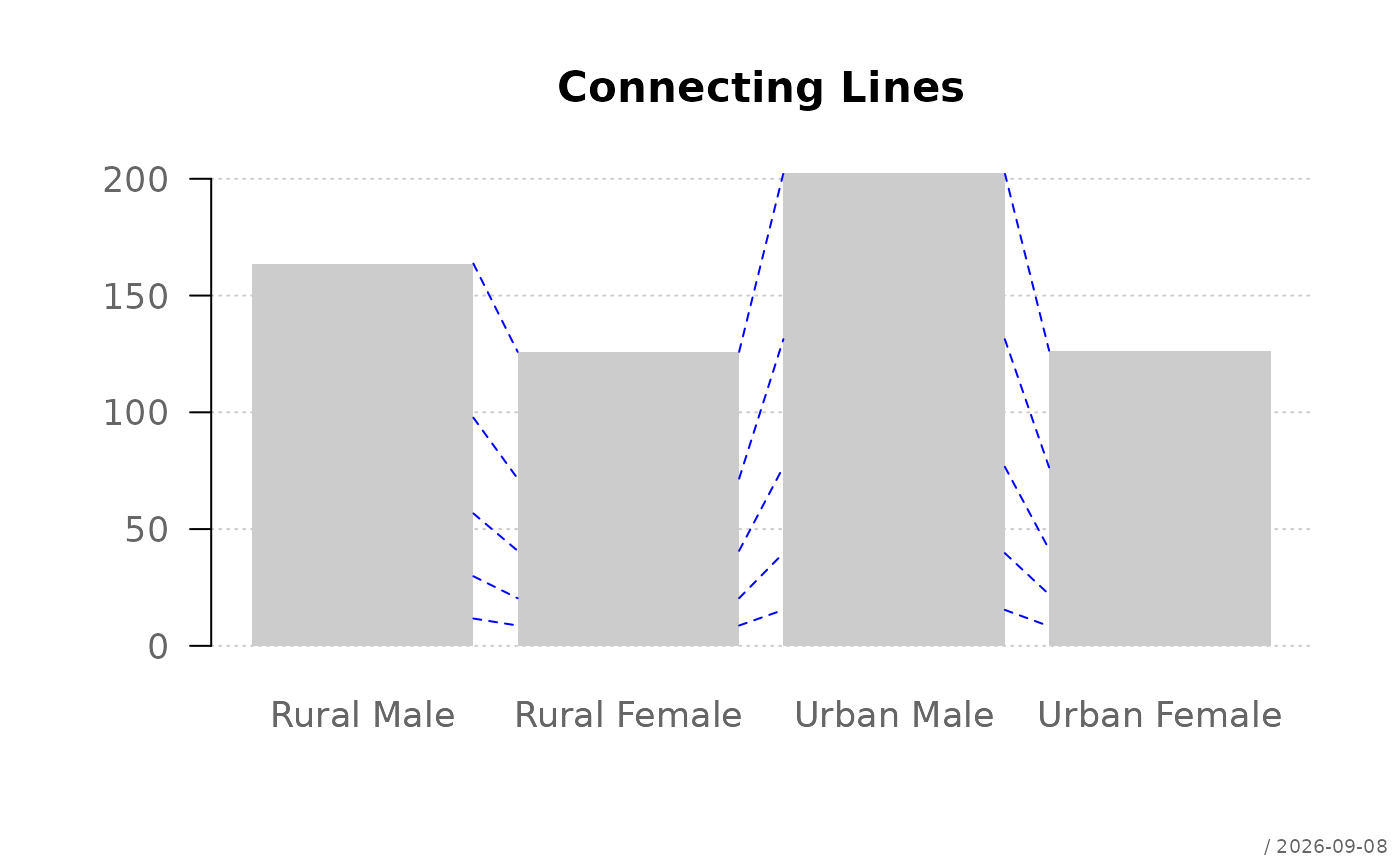 plotBar(VADeaths, connLines = list(lwd=1, col="blue"),
box=FALSE, las=1, main="Connecting Lines")
plotBar(VADeaths, connLines = list(lwd=1, col="blue"),
box=FALSE, las=1, main="Connecting Lines")
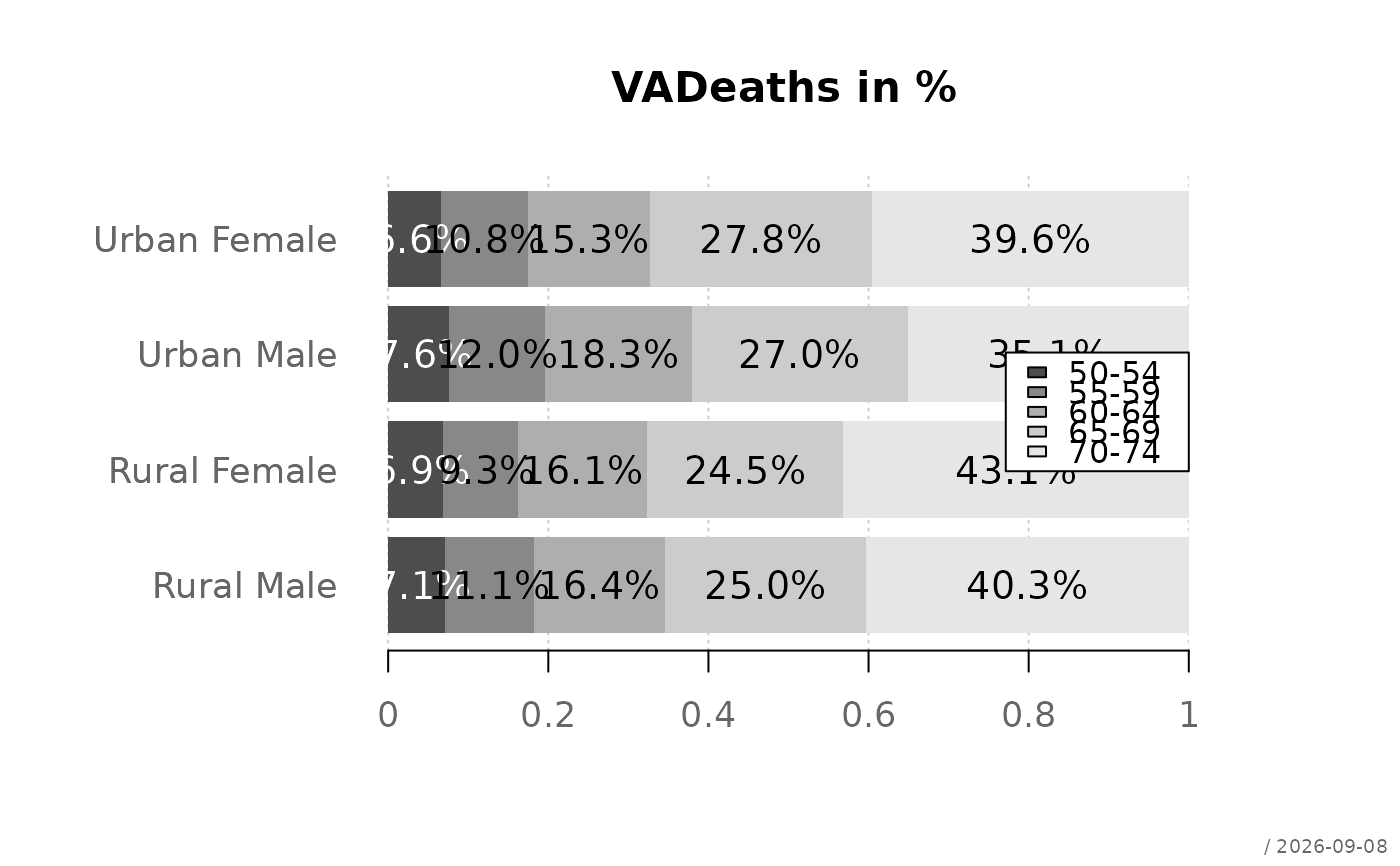 ptab <- proportions(VADeaths, margin=2)
plotBar(ptab,
las=1, main="VADeaths in %",
box=FALSE, horiz=TRUE,
col=(cols <- gray.colors(nrow(VADeaths))),
beside=FALSE,
text = list(labels=fm(ptab, fmt="%"), border=NA,
col=contrastCol(cols)))
ptab <- proportions(VADeaths, margin=2)
plotBar(ptab,
las=1, main="VADeaths in %",
box=FALSE, horiz=TRUE,
col=(cols <- gray.colors(nrow(VADeaths))),
beside=FALSE,
text = list(labels=fm(ptab, fmt="%"), border=NA,
col=contrastCol(cols)))
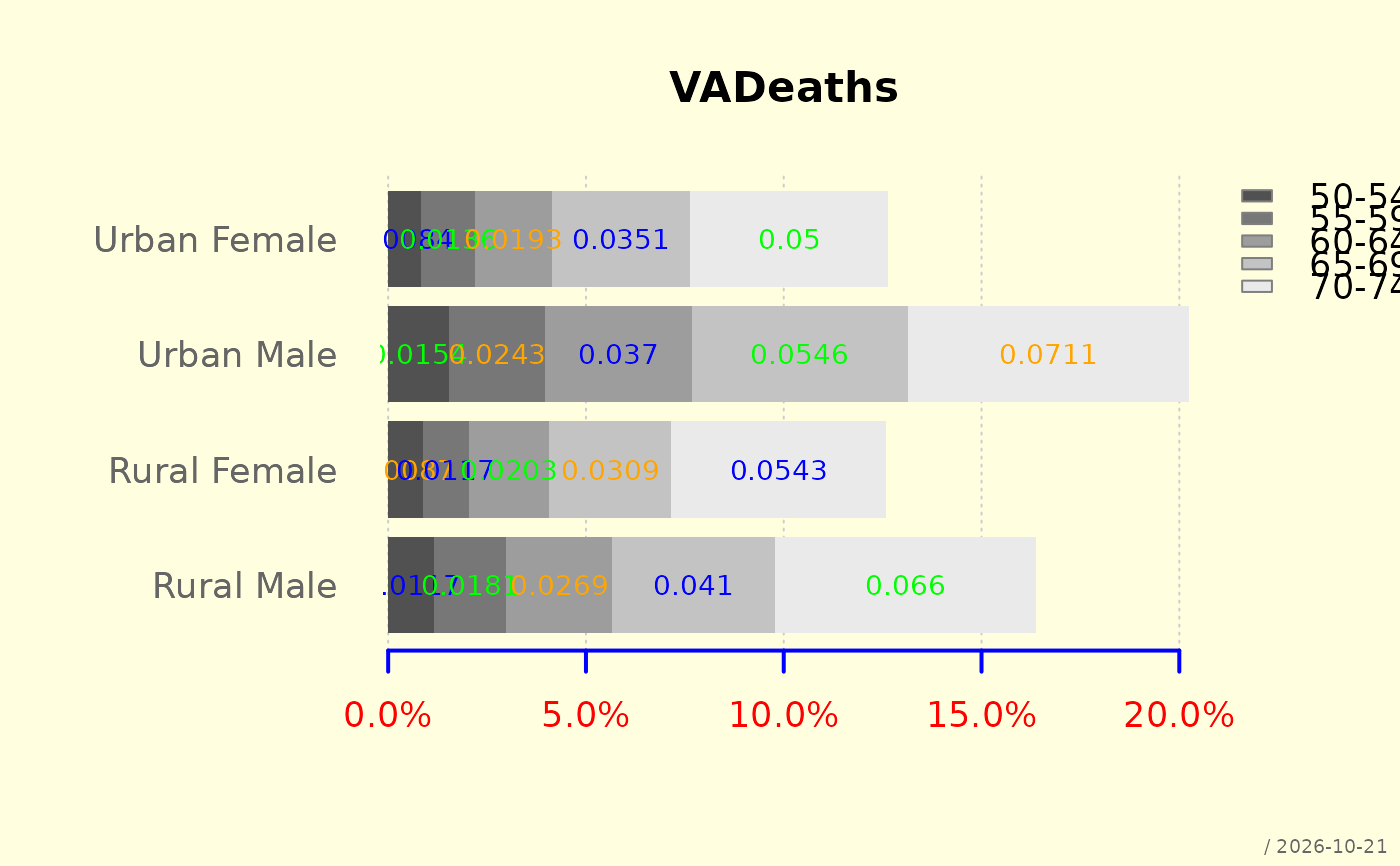
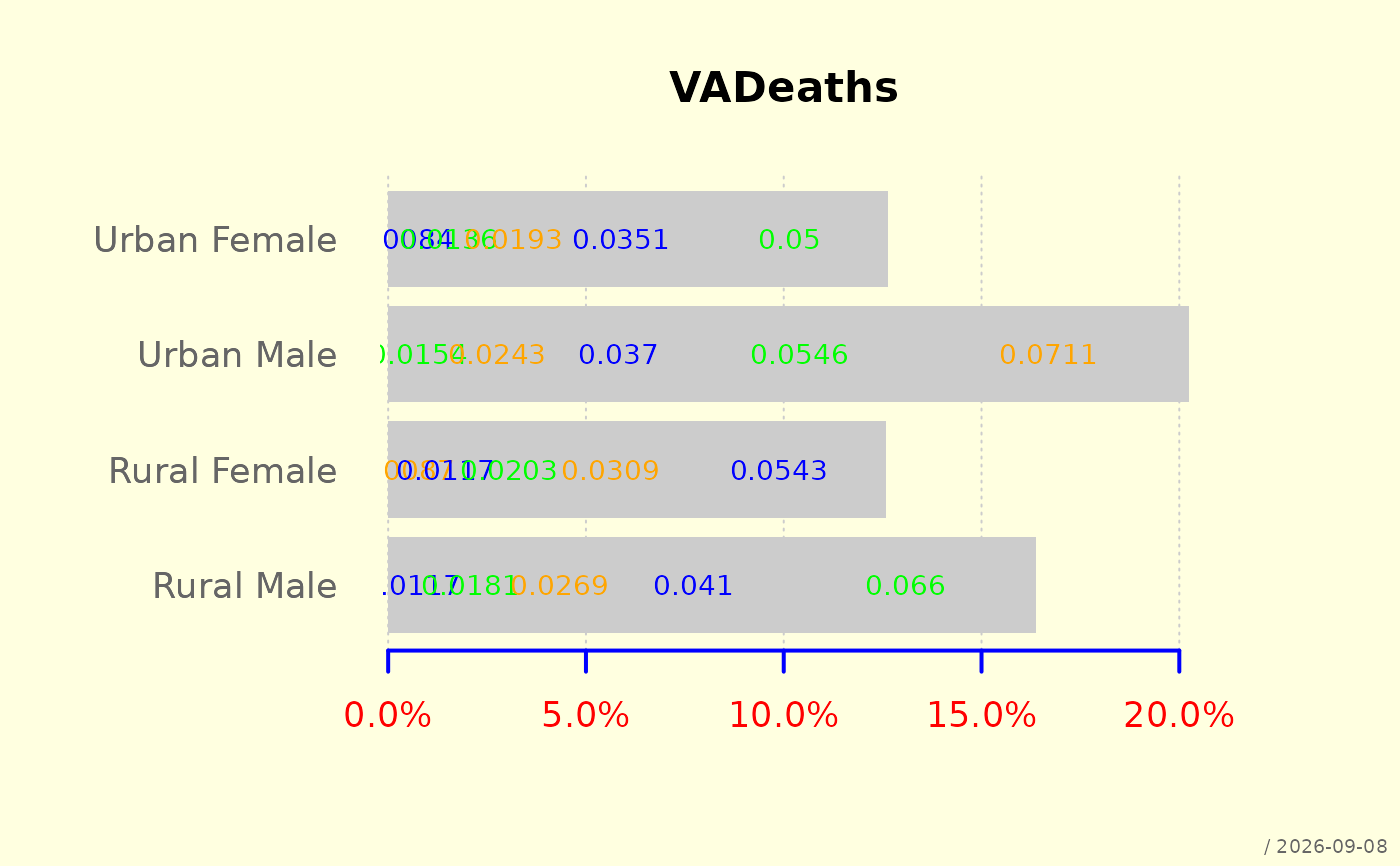 plotBar(VADeaths/1e3, box=FALSE, bg="lightyellow", main="VADeaths",
horiz=TRUE,
text=list(border=FALSE, cex=0.8, col=c("blue", "green","orange")),
mar=c(right=5),
yax = list(fmt="%", d=0, big=",",
col="red", col.axis="blue", lwd=2))
plotBar(VADeaths/1e3, box=FALSE, bg="lightyellow", main="VADeaths",
horiz=TRUE,
text=list(border=FALSE, cex=0.8, col=c("blue", "green","orange")),
mar=c(right=5),
yax = list(fmt="%", d=0, big=",",
col="red", col.axis="blue", lwd=2))