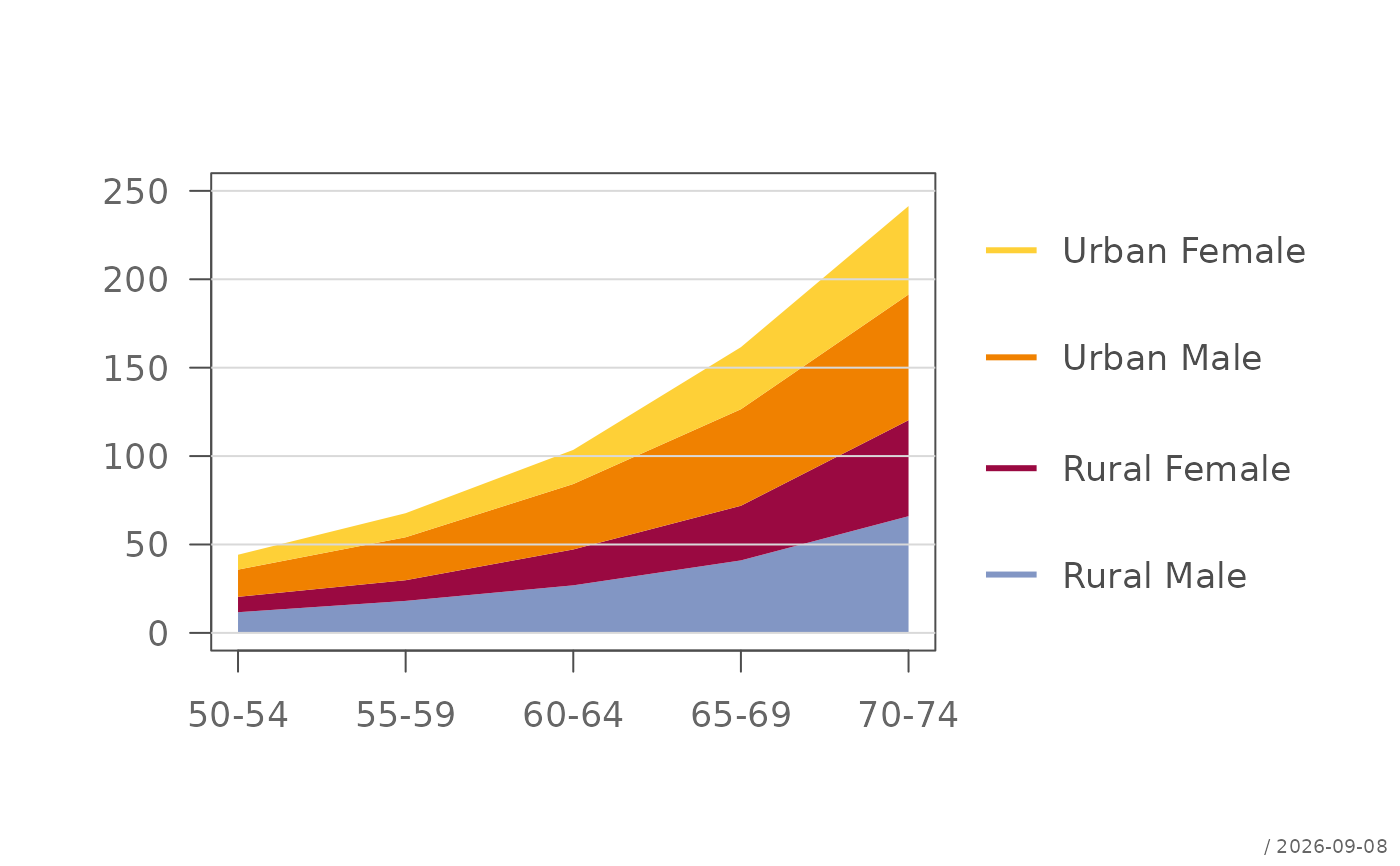
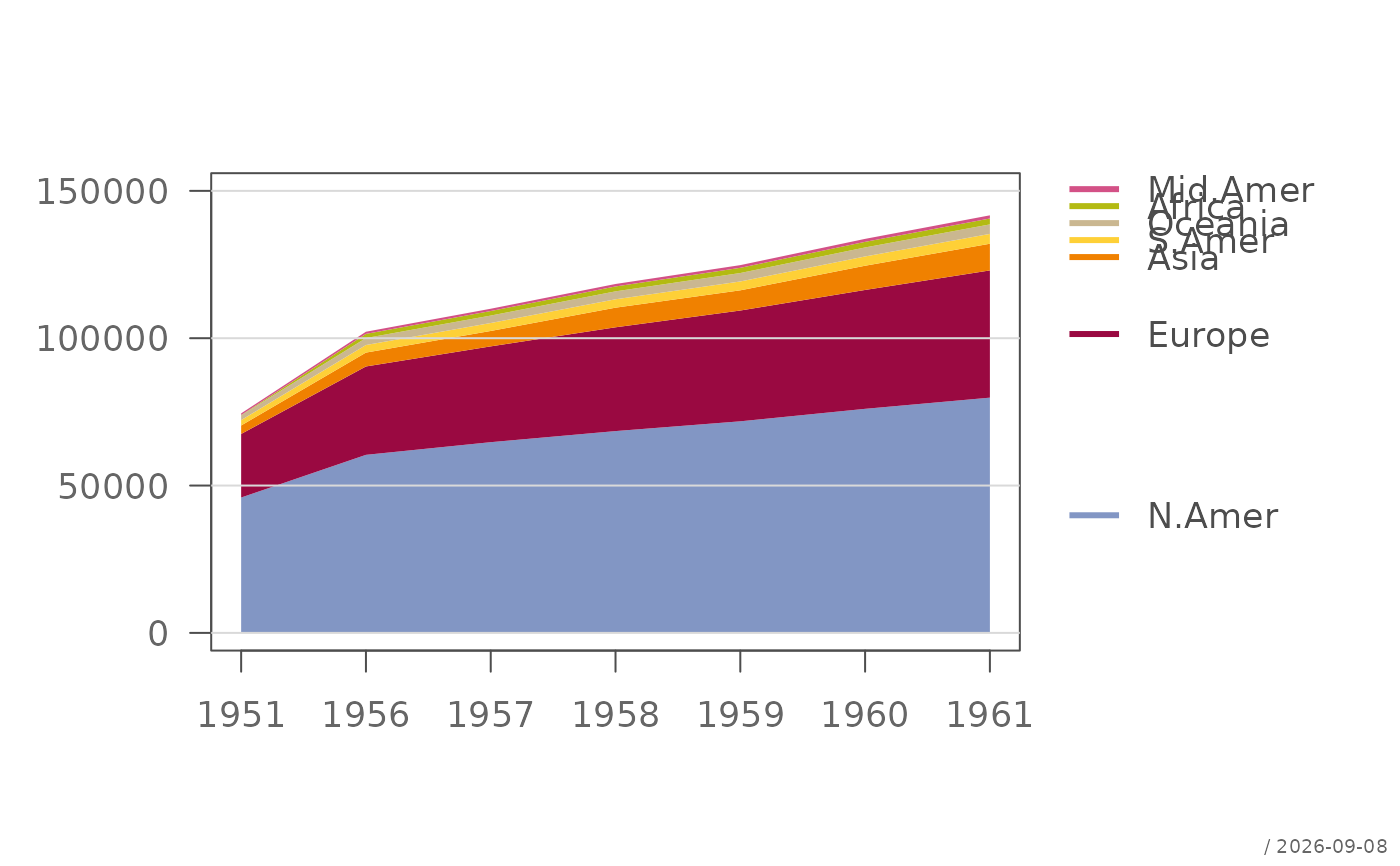
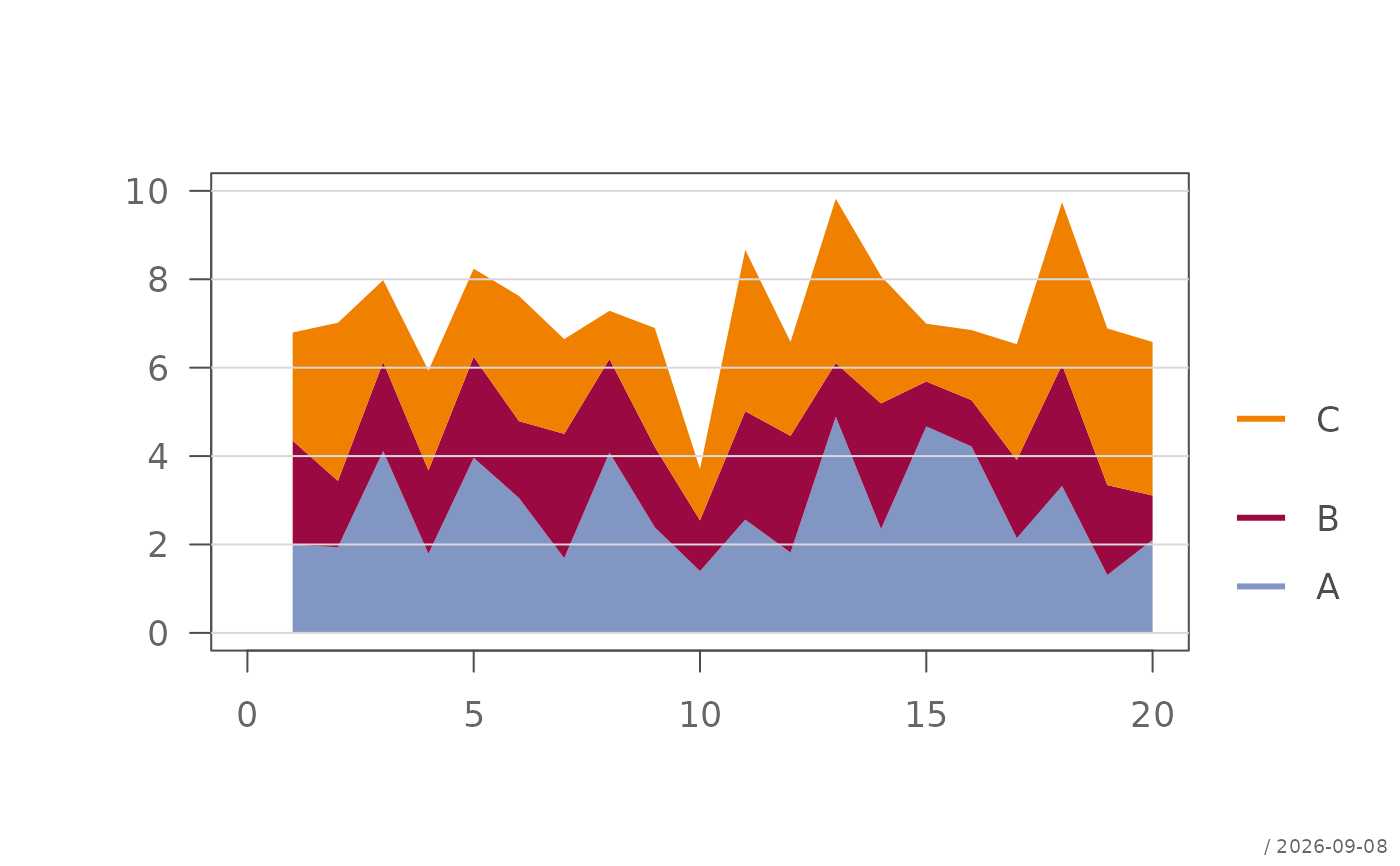
Draws one or several stacked area series using cumulative polygons.
The function accepts either a matrix of values or separate x and
y coordinates. Multiple series are displayed as stacked areas.
Usage
plotArea(
  x,
  y,
  main = NULL,
  xlab = "",
  ylab = "",
  xlim = NULL,
  ylim = NULL,
  prop = FALSE,
  col = NULL,
  grid = .useTheme,
  legend = TRUE,
  stamp = .useTheme,
  ...
)
Arguments
- x
numeric vector, matrix or data frame. If
yis missing,xis interpreted as a matrix of series where rows correspond to x positions and columns to individual areas.- y
optional numeric vector or matrix giving the y-values. If supplied,
xis interpreted as the x-coordinates.- main
main title of the plot.
- xlab
label for the x-axis.
- ylab
label for the y-axis.
- xlim
limits for the x-axis.
- ylim
limits for the y-axis.
- prop
logical indicating whether rows should be converted to proportions so that stacked areas sum to one.
- col
fill colours used for the areas.
- grid
controls the background grid.
.useTheme(default) follows the active theme (getTheme()$grid),TRUEdraws it,FALSE,NULLorNAsuppress it, and a named list is passed tographics::grid().- legend
logical or list controlling the legend. If
TRUE, a legend is drawn using the column names of the data. If a list is supplied, its elements are passed to the internal legend drawing routine.- stamp
controls the corner stamp.
.useTheme(default) resolves togetTheme()$stamp.TRUE/FALSE/NULL, a string, or a named list forstamp().- ...
additional graphical parameters passed to
graphics::par()via.applyParFromDots()and to the plotting functions.
Value
Invisibly returns a list containing:
xthe x-values used for plotting,ythe original y-values,cumulativethe cumulative values used to construct the areas,legendthe legend specification if drawn.
Details
If y is missing, x is interpreted as a matrix and each column
is drawn as a separate stacked area.
The cumulative sums are calculated row-wise and displayed as polygons stacked on top of each other.
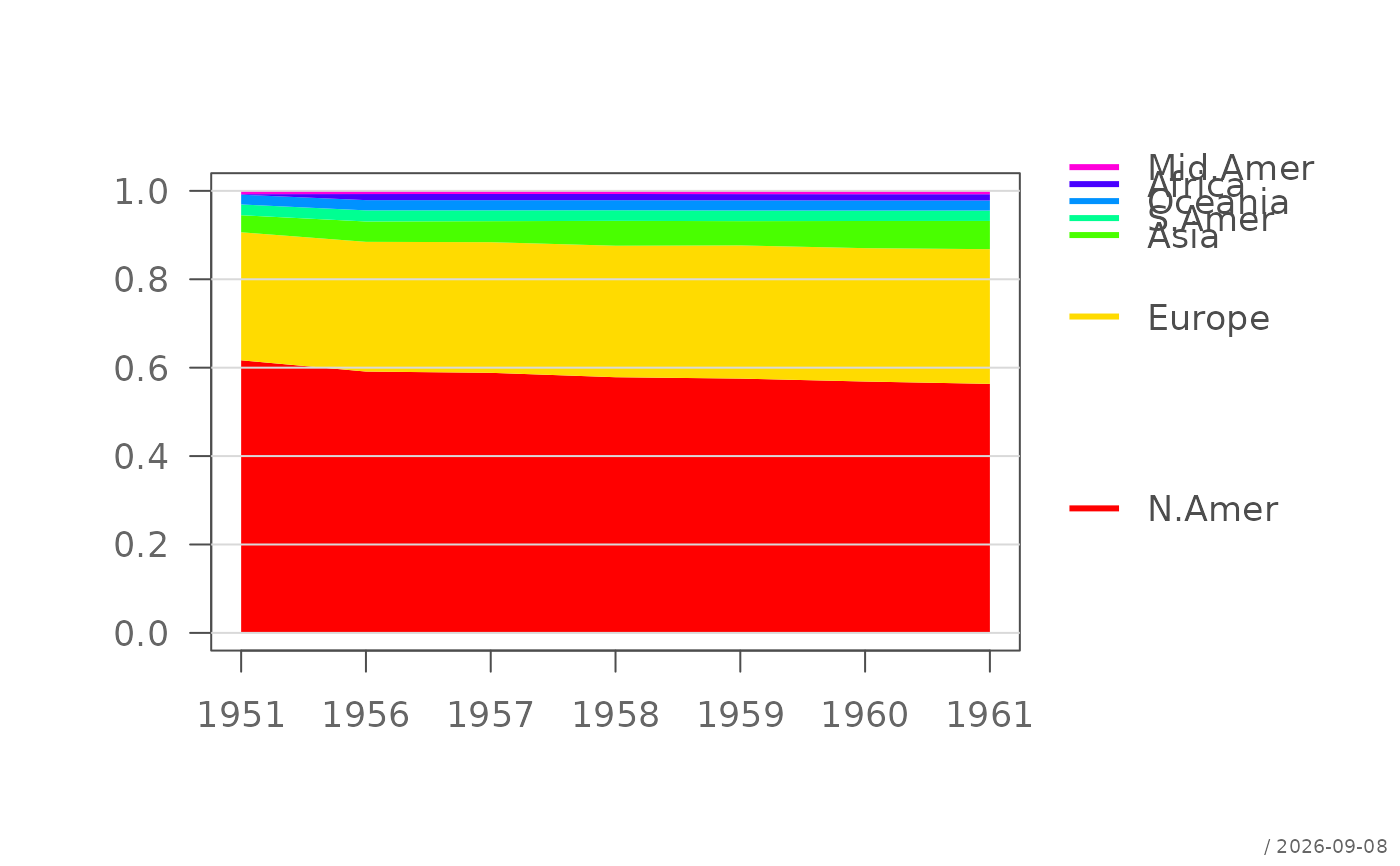
If prop = TRUE, each row is converted to proportions before plotting,
so the stacked areas sum to one.
Row names are used as x-axis labels when available and y is omitted.
See also
Other plot.univariate:
plotBar(),
plotBox(),
plotCatDist(),
plotDens(),
plotDensBox(),
plotDot(),
plotECDF(),
plotFreqDist(),
plotLines(),
plotQQ(),
plotViolin()