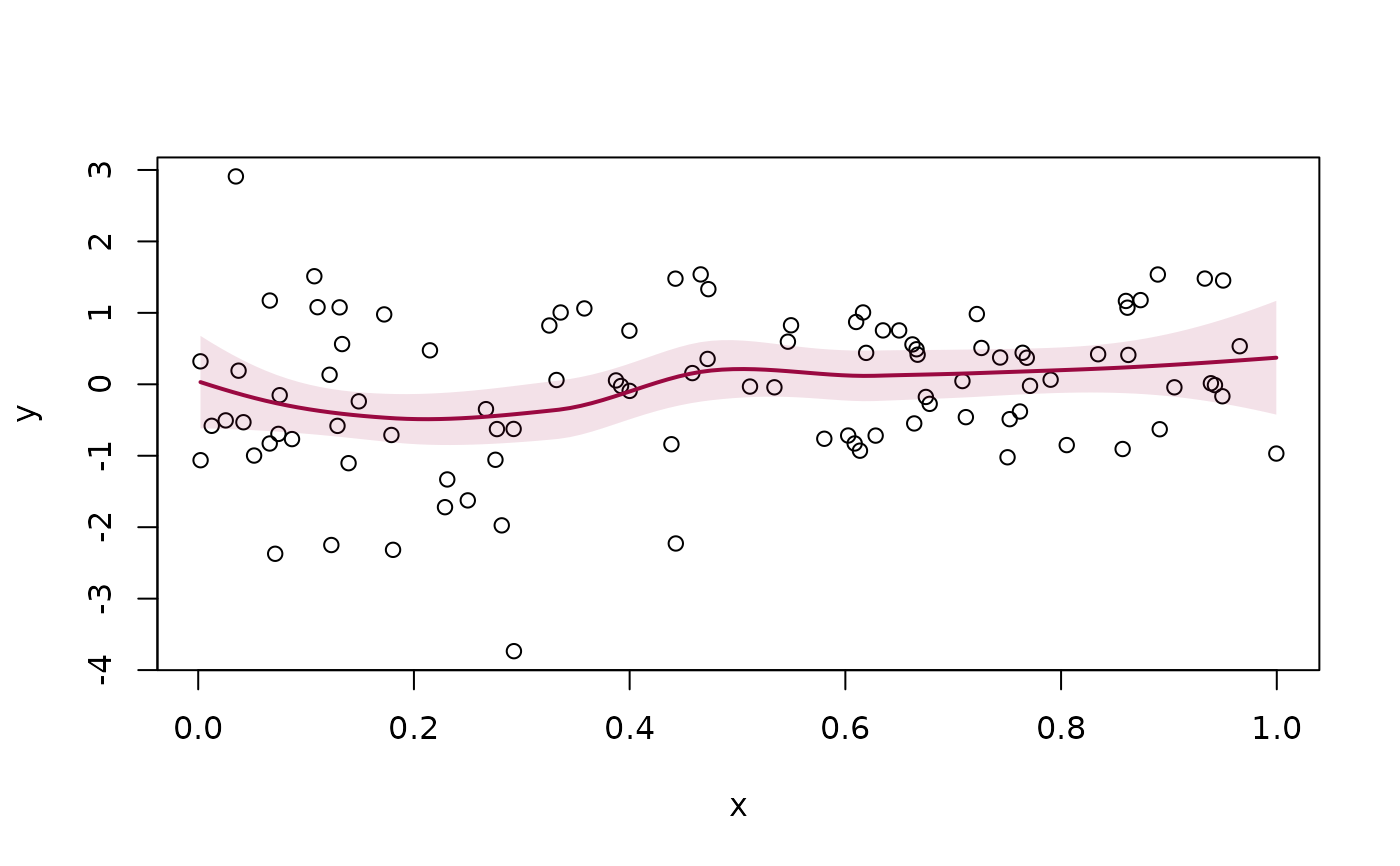
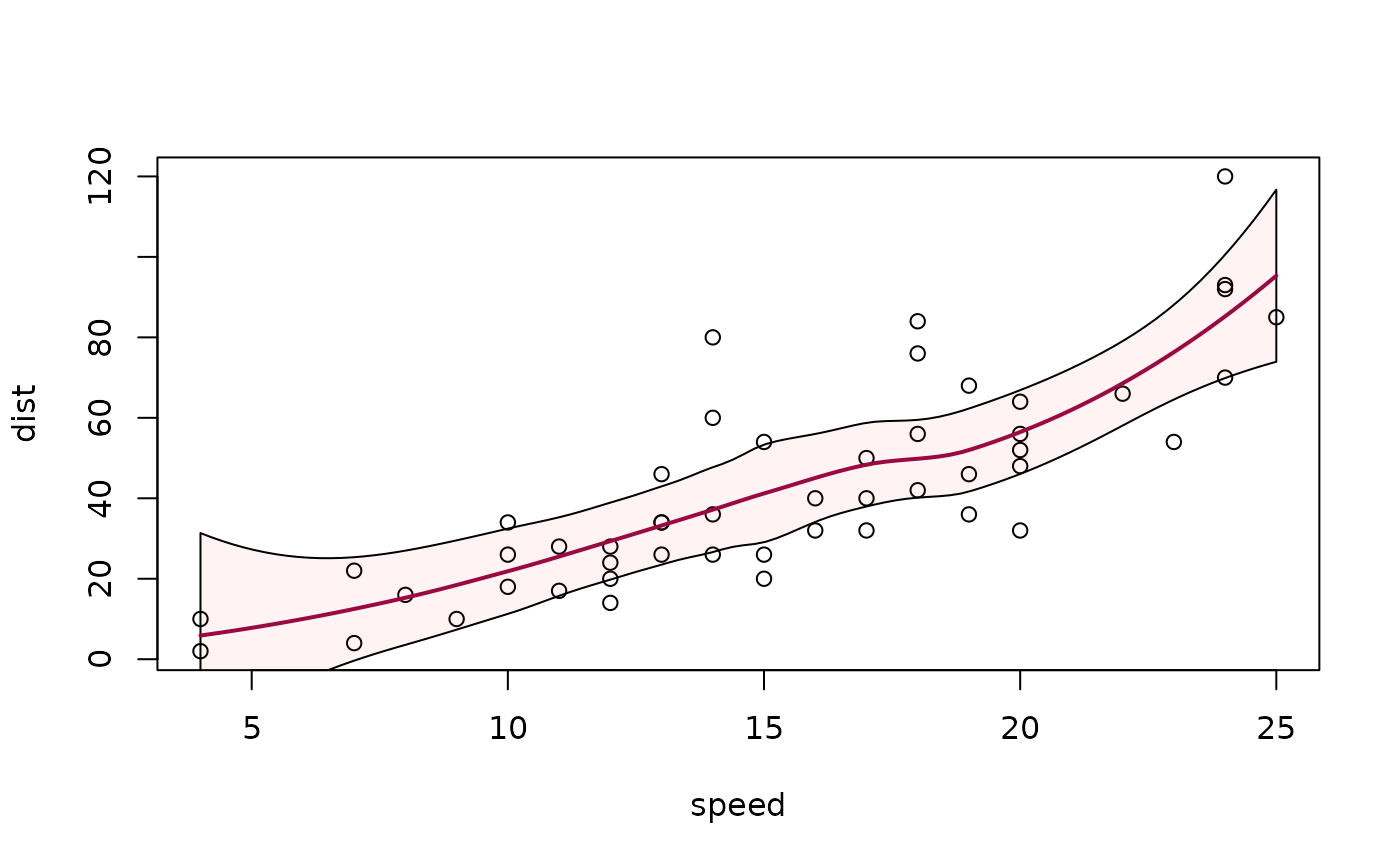
Add a loess smoother to an existing plot. The function first calculates
predictions from a loess object and then adds the fitted smoother
together with an optional confidence band.
Arguments
- x
a fitted
loess()object.- col
line color of the smoother.
.useTheme(default) resolves togetTheme()$twin[1]- the first of the theme's two-color pair (see theme).- lwd
line width.
- lty
line type.
- type
plotting type passed to
lines().- n
number of points used for plotting the fit.
- band
controls the confidence band. May be
TRUE,FALSE,NULL,NA, or a named list. The confidence level is specified viaconf.level, all other elements are graphical parameters of the band. Default islist(conf.level = 0.95).- ...
further graphical parameters passed to
lines()for the smoother.
Value
No return value (invisible NULL), called for its side effect of
adding the smoother and its confidence band to the current plot.
Details
The confidence band is controlled via band. This argument may be:
FALSE,NULLorNA: suppress the bandTRUE: draw the band with default settingsa named list: customize the band appearance and confidence level
See also
loess(), scatter.smooth(),
smooth.spline()
Other graphics.trendlines:
lines.lm(),
splineCI