
Fit a smoothing spline and optionally add confidence bands.
Arguments
- x
spline object returned by
splineX().- ...
for
splineX(), further arguments passed tostats::smooth.spline(); forlines(), further graphical parameters passed tolines().- formula
A formula of the form
lhs ~ rhs, wherelhsgives the response values andrhsthe corresponding groups or explanatory variables.- data
an optional matrix or data frame (or similar; see
stats::model.frame()) containing the variables in the formula. By default the variables are taken fromenvironment(formula).- subset
an optional vector specifying a subset of observations to be used in the analysis.
- na.action
A function which indicates what should happen when the data contain
NAs. Defaults togetOption("na.action").- weights
optional vector of weights, a column of
dataor a vector of the length of the original data. It is subject tosubsetandna.actionlike the variables of the formula.- col
line color of the smoother.
- lwd
line width.
- lty
line type.
- type
plotting type passed to
lines().- band
controls the confidence band. May be
TRUE,FALSE,NULL,NA, or a named list. The confidence level is specified viaconf.level, all other elements are graphical parameters of the band. Default islist(conf.level = 0.95).
Value
splineX() returns the fit of stats::smooth.spline() with the
additional class "SplineX". The lines() method returns no value
(invisible NULL); it is called for its side effect of adding the smoother
and its confidence band to the current plot.
Details
Confidence bands are controlled via band. These arguments can be:
FALSE,NULLorNA: suppress the bandTRUE: draw the band with default settingsa named list: customize the band appearance and confidence level
See also
Other graphics.trendlines:
lines.lm(),
lines.loess()
Examples
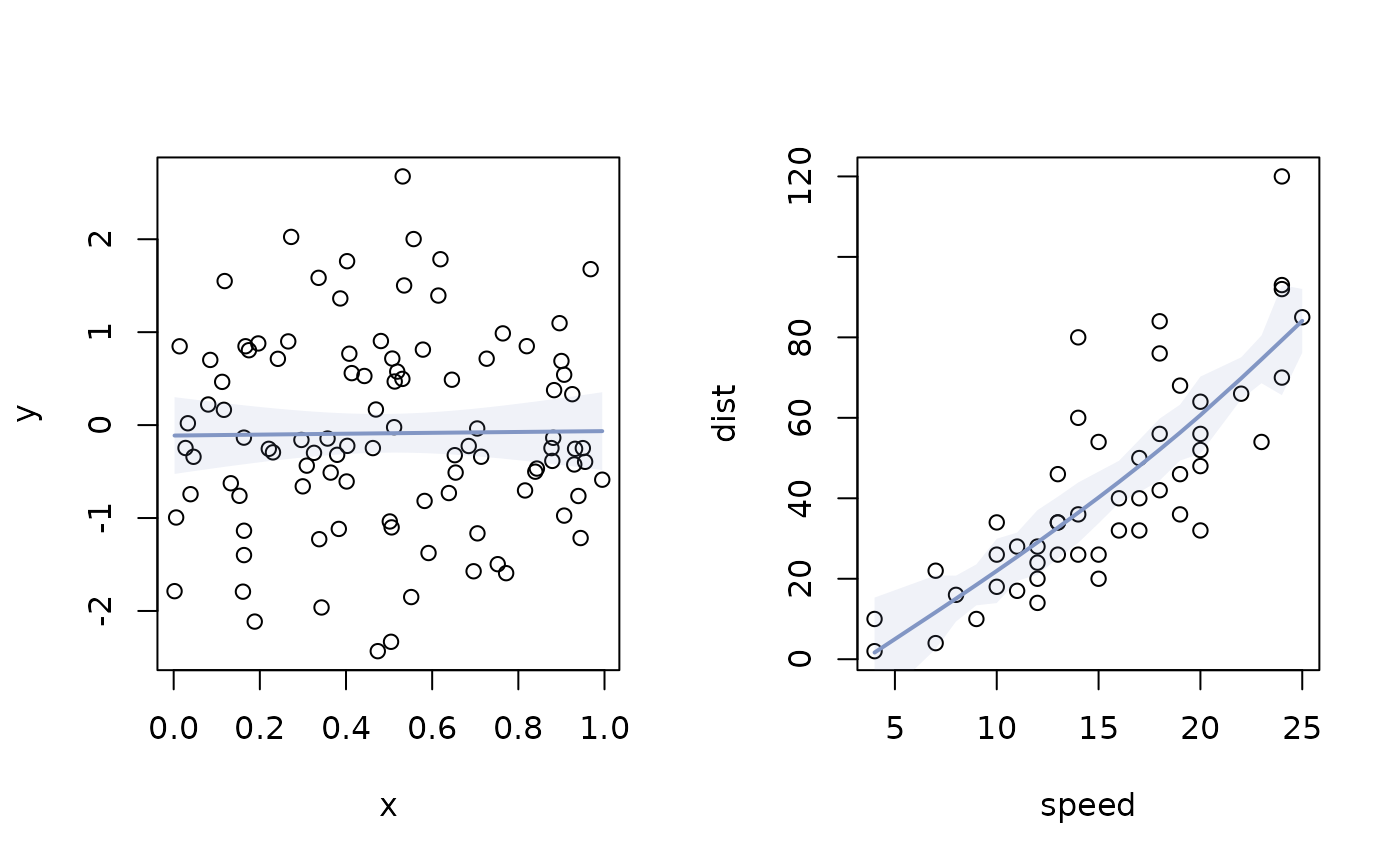
op <- par(no.readonly = TRUE)
par(mfrow = c(1, 2))
x <- runif(100)
y <- rnorm(100)
plot(x, y)
lines(splineX(y ~ x))
plot(dist ~ speed, cars)
lines(splineX(dist ~ speed, cars))
 # subset and weights, both evaluated in data
plot(dist ~ speed, cars)
lines(splineX(dist ~ speed, cars, subset = speed > 10,
weights = sqrt(speed)))
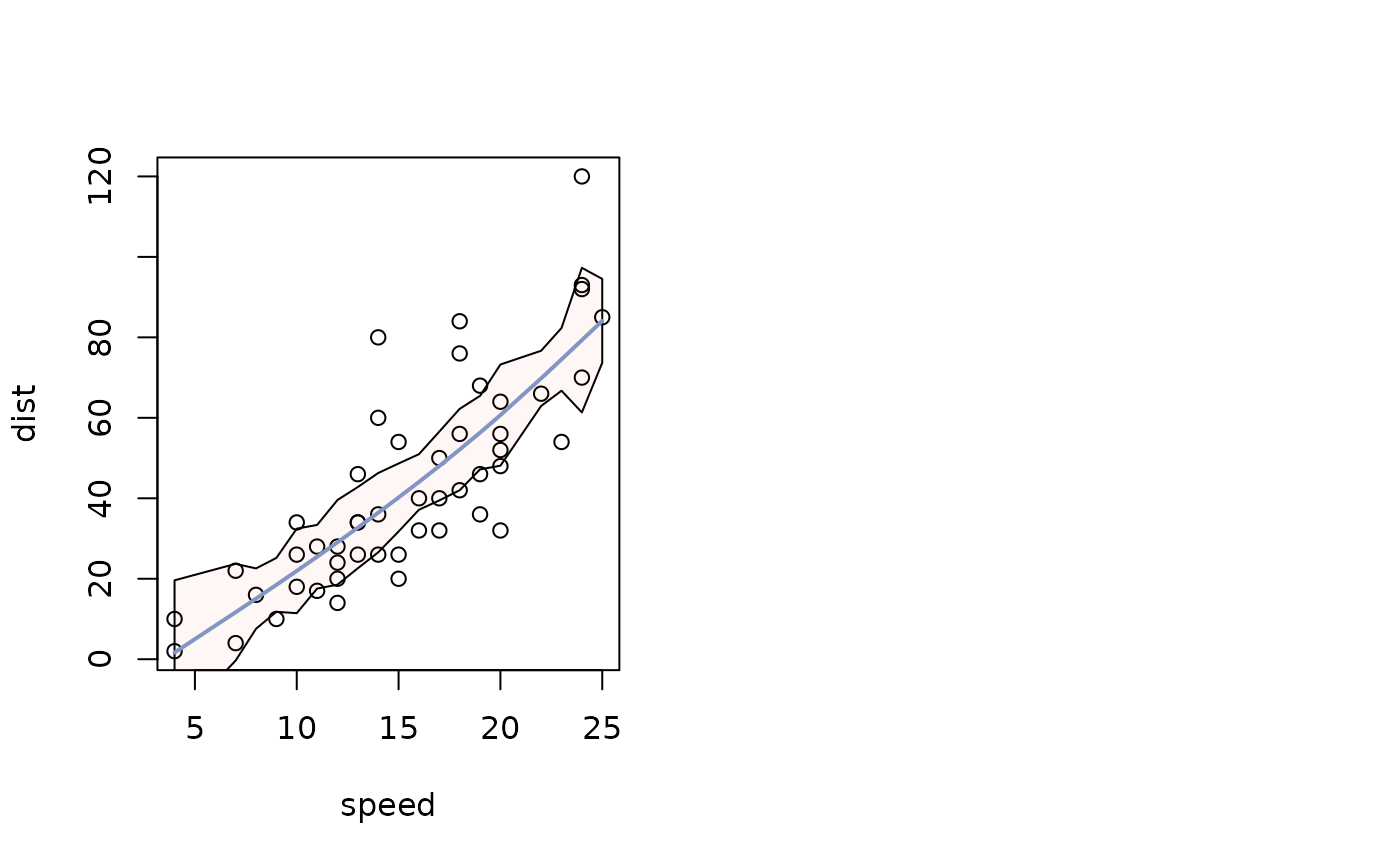
plot(dist ~ speed, cars)
lines(
splineX(dist ~ speed, cars),
band = list(
conf.level = 0.99,
col = addOpacity("red", 0.3),
border = "black"
)
)
 par(op)