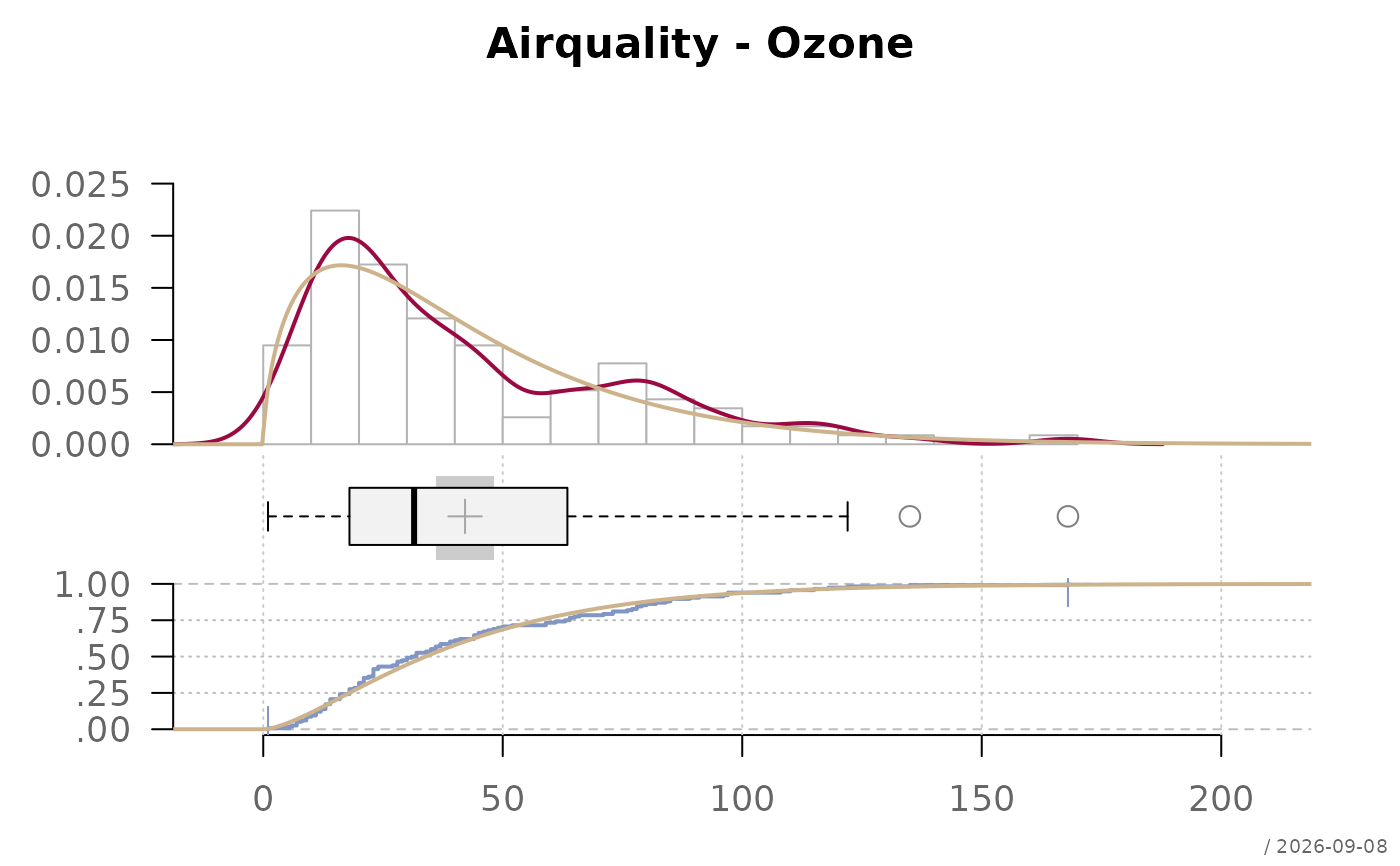
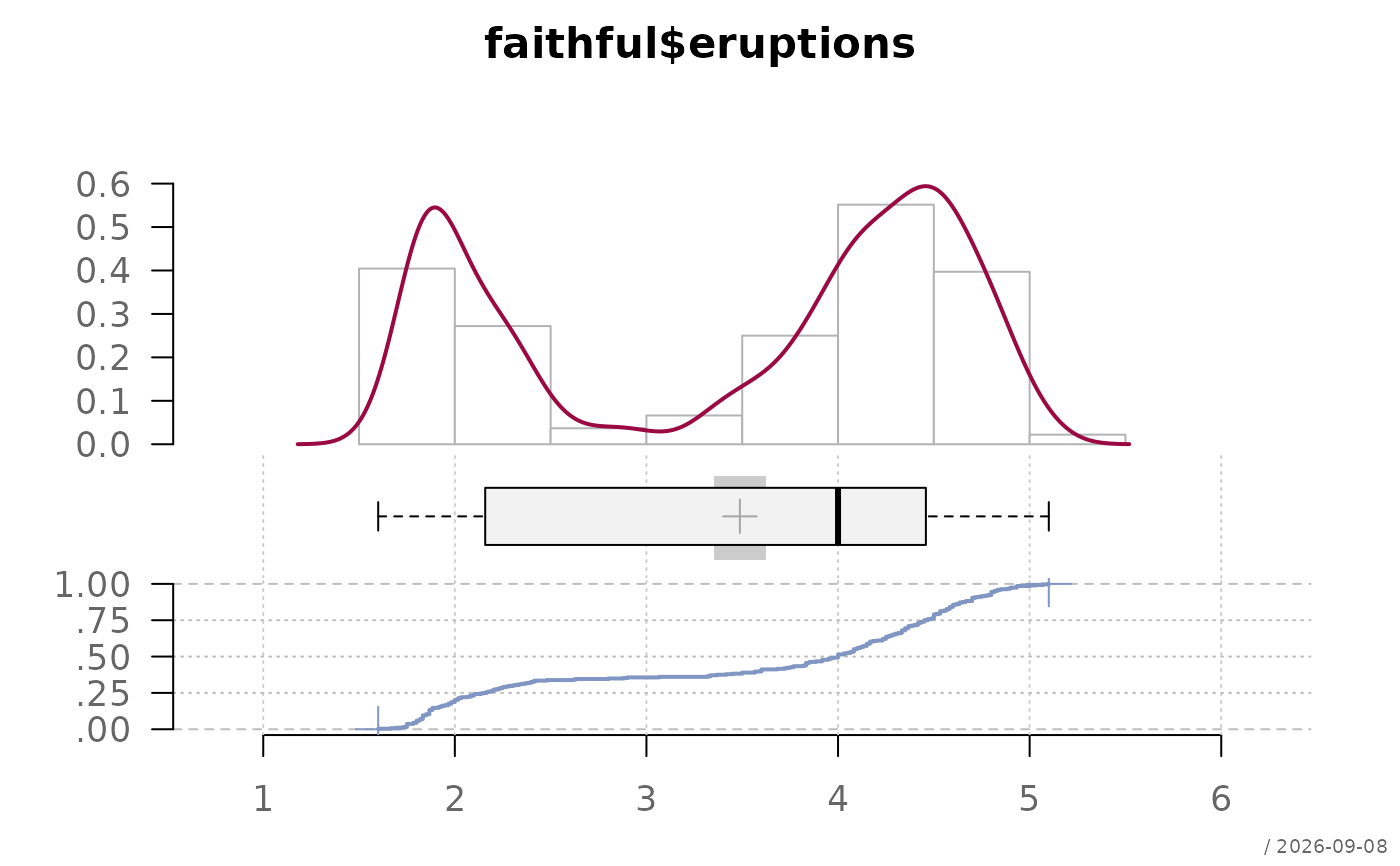
Creates a univariate graphical summary combining a histogram (or probability mass plot for discrete data), a kernel density curve, a boxplot, and an empirical cumulative distribution function in a single multi-panel figure. Optional components include a rug, and fitted theoretical distribution curves for both the histogram and the ECDF panel.
Usage
plotFdist(
  x,
  main = NULL,
  xlab = "",
  xlim = NULL,
  heights = NULL,
  hist = TRUE,
  dens = TRUE,
  rug = FALSE,
  curve = FALSE,
  boxplot = TRUE,
  ecdf = TRUE,
  curveEcdf = FALSE,
  stamp = .useTheme,
  ...
)
Arguments
- x
numeric vector whose distribution is to be plotted.
- main
main title.
NULL(default) derives the title fromdeparse(substitute(x))."",NA, orFALSEsuppress the title and compact the top margin.- xlab
label for the x-axis. The variable name is typically placed in
main, so this defaults to"".- xlim
range of the x-axis.
NULL(default) uses a pretty range of the non-missing values inx.- heights
numeric vector of relative panel heights for
layout(): three values for histogram/boxplot/ecdf, two for histogram/boxplot or histogram/ecdf only.NULL(default) chooses automatically.- hist
controls the histogram panel.
TRUE(default) uses package defaults;FALSE/NAsuppresses the panel (xlimthen falls back to the pretty range of the data); a list overrides specific arguments forwarded tographics::hist(). The elementtypeselects the plot style:"hist"(standard histogram, chosen automatically for continuous or high-cardinality data) or"mass"(vertical bars per unique value, for discrete/low-cardinality data).- dens
controls the kernel density curve.
TRUE(default) draws a curve viastats::density(); a list overrides specific arguments (e.g.list(bw = 0.1, col = "red")).- rug
controls a rug plot.
FALSE(default) suppresses it;TRUEor a list draw a rug viagraphics::rug().- curve
controls a fitted theoretical distribution curve on the histogram.
FALSE(default),NULL, orNAsuppress it;TRUEdraws a normal curve withmean(x)/sd(x); a list may includeexpras a character string, expression, or function ofxfor any distribution (e.g.list(expr = "dt(x, df=2)", col = "darkgreen")). A characterexpris evaluated in the caller's environment, so local variables may be referenced (see the gamma example below).- boxplot
controls the boxplot panel.
TRUE(default) draws a horizontal boxplot with a mean marker and CI band;FALSE/NAsuppresses the panel. A list overrides arguments forwarded tographics::boxplot(); two extra elements control the mean display:pch.mean(default3) andcol.meanci(defaultgetTheme()$grid$col). Set either toNAto suppress that element.- ecdf
controls the ECDF panel.
TRUE(default) callsplotECDF(); a list overrides specific arguments.- curveEcdf
controls a fitted theoretical CDF curve on the ECDF panel, analogous to
curve.FALSE(default) suppresses it.- stamp
controls the corner stamp.
.useTheme(default) resolves togetTheme()$stamp.TRUE/FALSE/NULL, a string, or a named list forstamp().- ...
further graphical parameters passed to
par()via the internal framework. Note thatmargiven here sets the outer margins (oma) of the multi-panel figure; the inner panel margins are managed internally and cannot be overridden.
Details
Each plot component is controlled via a single argument accepting
bedrock::callIf() semantics:
TRUE: draw with package defaultsFALSE,NULL, orNA: suppress entirelya named list: draw with the given overrides merged into the defaults
Performance: for very large vectors (n > 1e7) the density curve, ECDF,
and semi-transparent boxplot outliers will still take noticeable time.
For exploratory work on very large data, consider sampling first:
plotFdist(x[sample(length(x), 5000)]).
See also
hist(), boxplot(), plotECDF(),
density(), rug(), layout(),
theme
Other plot.univariate:
plotArea(),
plotBar(),
plotBox(),
plotCatDist(),
plotDens(),
plotDensBox(),
plotDot(),
plotECDF(),
plotLines(),
plotQQ(),
plotViolin()
Examples
plotFdist(faithful$eruptions)
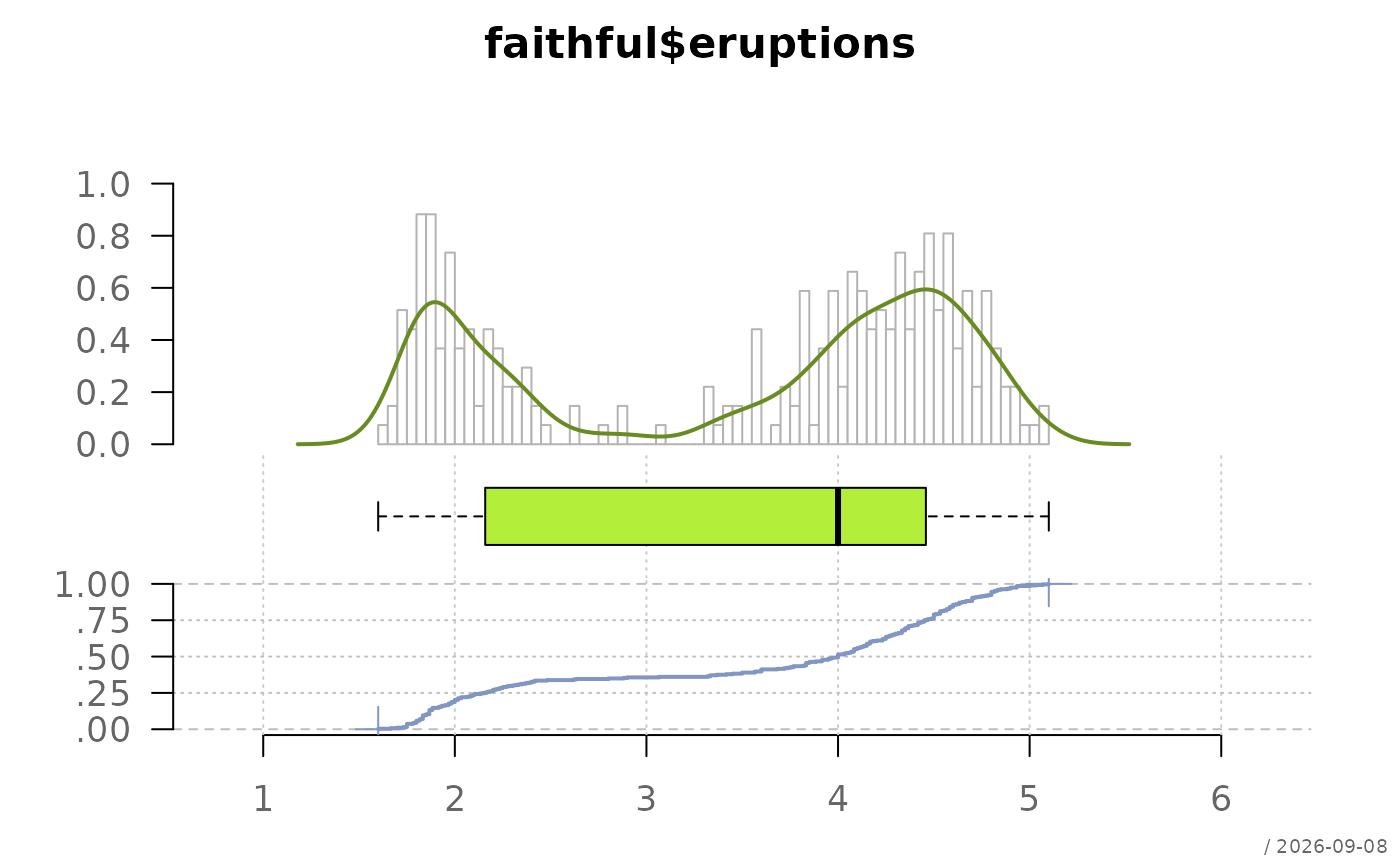
 # custom histogram breaks, density color, boxplot styling
plotFdist(faithful$eruptions,
hist = list(breaks = 50),
dens = list(col = "olivedrab4"),
boxplot = list(col = "olivedrab2", pch.mean = NA, col.meanci = NA))
# custom histogram breaks, density color, boxplot styling
plotFdist(faithful$eruptions,
hist = list(breaks = 50),
dens = list(col = "olivedrab4"),
boxplot = list(col = "olivedrab2", pch.mean = NA, col.meanci = NA))
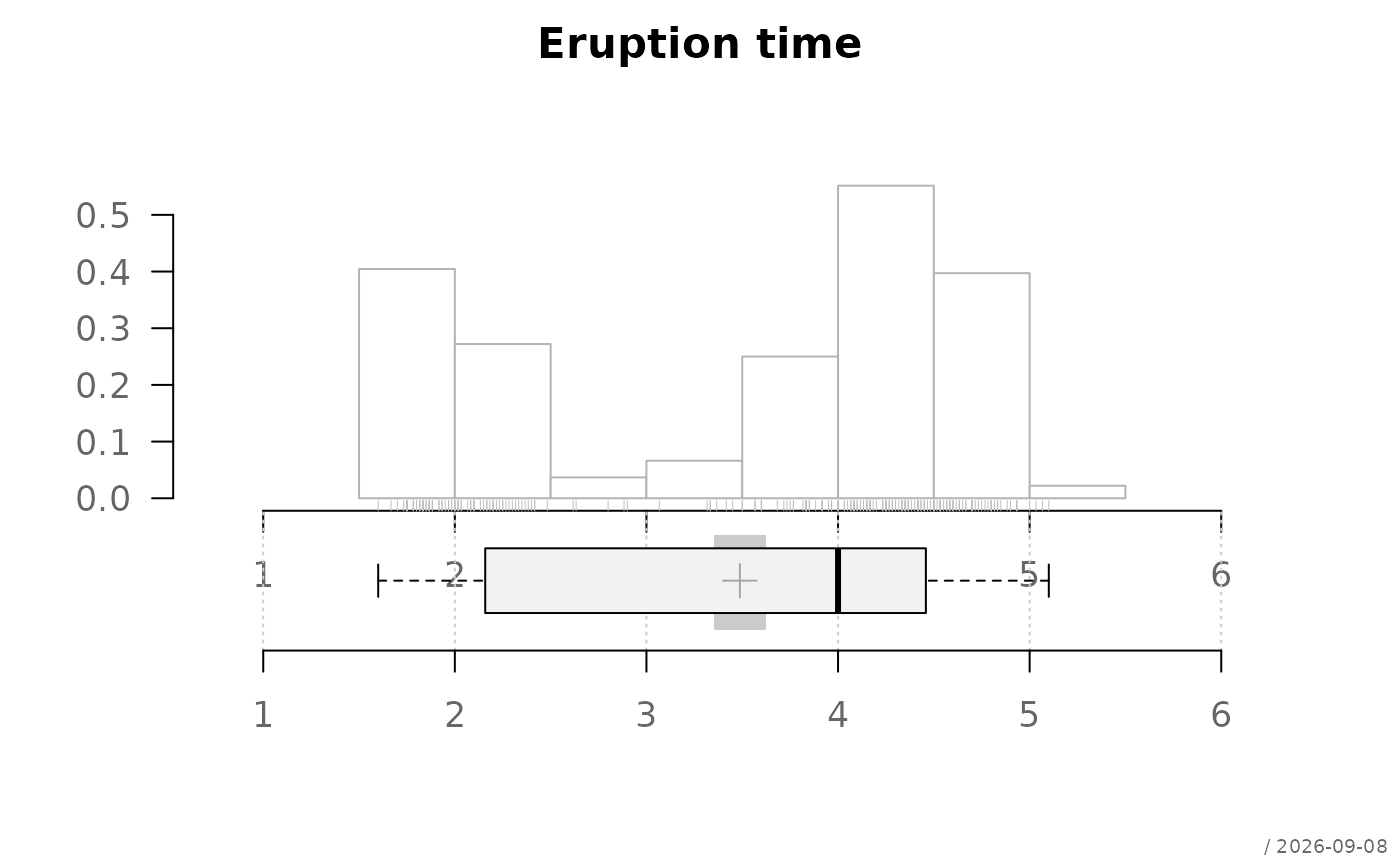
 # no density, no ecdf, add rug instead
plotFdist(faithful$eruptions,
dens = FALSE, ecdf = FALSE,
hist = list(xaxt = "s"),
rug = TRUE,
heights = c(3, 2.5),
main = "Eruption time")
# no density, no ecdf, add rug instead
plotFdist(faithful$eruptions,
dens = FALSE, ecdf = FALSE,
hist = list(xaxt = "s"),
rug = TRUE,
heights = c(3, 2.5),
main = "Eruption time")
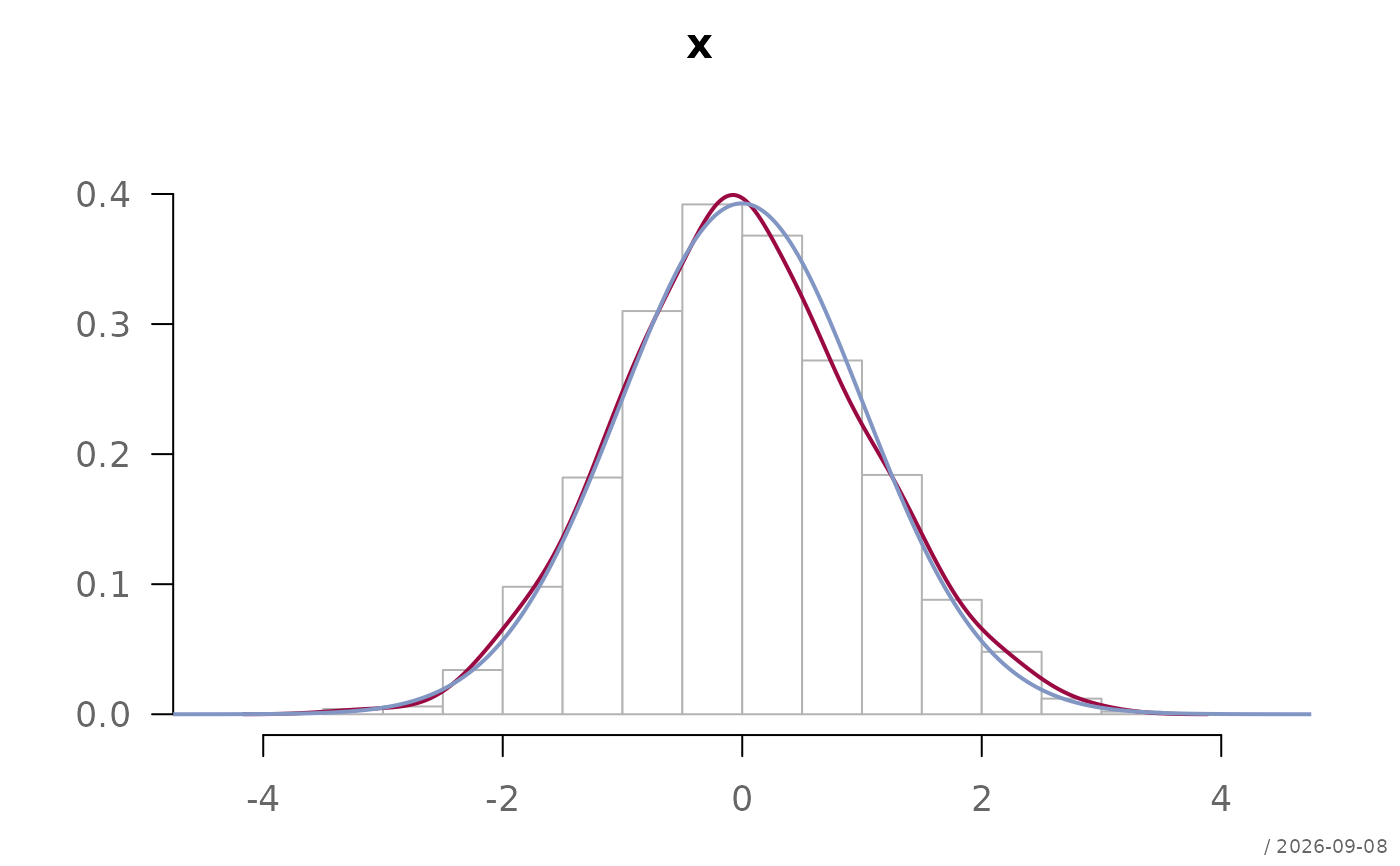
 # overlay a normal density curve
x <- rnorm(1000)
plotFdist(x, curve = TRUE, boxplot = FALSE, ecdf = FALSE)
# overlay a normal density curve
x <- rnorm(1000)
plotFdist(x, curve = TRUE, boxplot = FALSE, ecdf = FALSE)
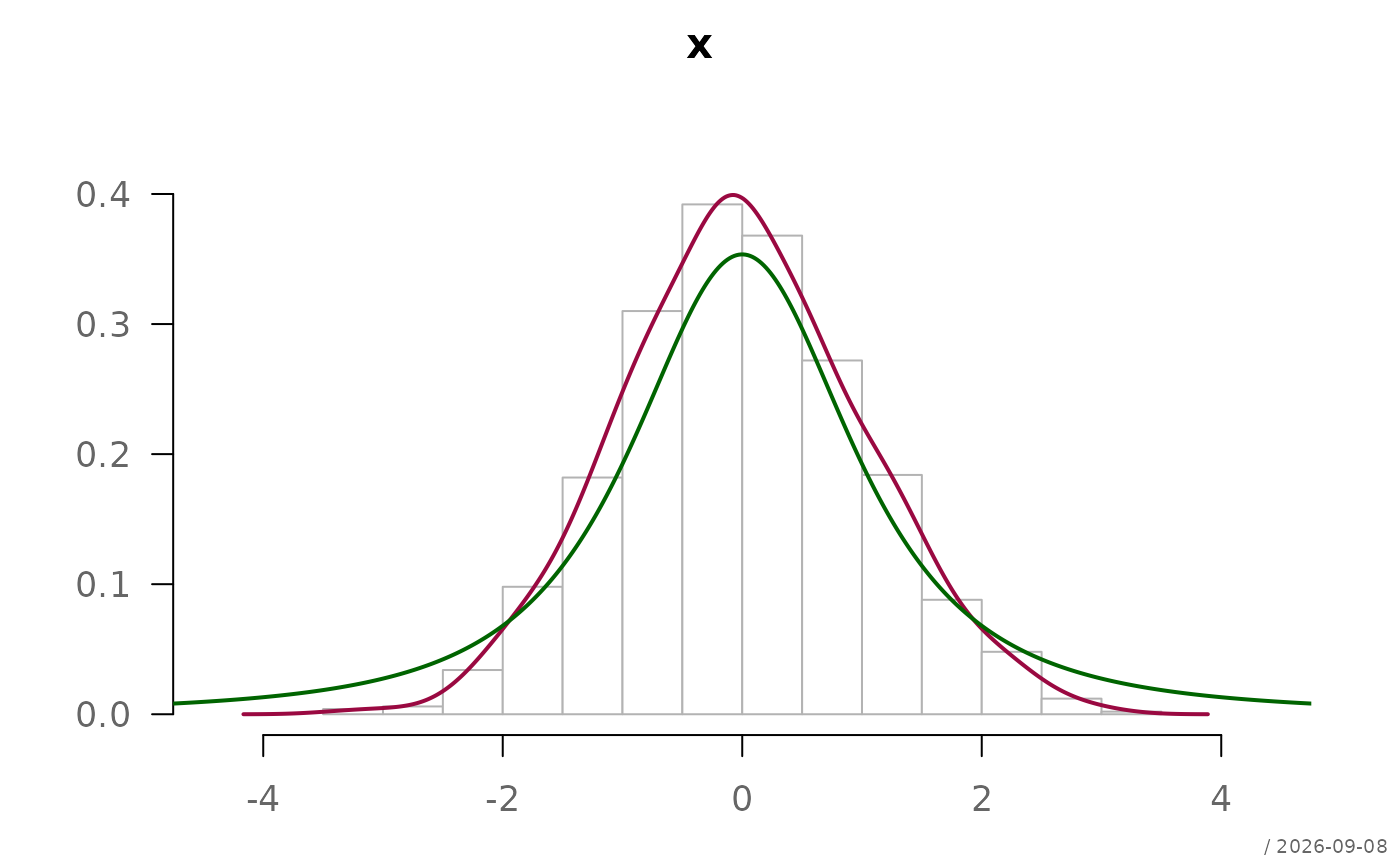
 # compare with a t-distribution curve
plotFdist(x,
curve = list(expr = "dt(x, df=2)", col = "darkgreen"),
boxplot = FALSE, ecdf = FALSE)
# compare with a t-distribution curve
plotFdist(x,
curve = list(expr = "dt(x, df=2)", col = "darkgreen"),
boxplot = FALSE, ecdf = FALSE)
 # overlay gamma distribution on both histogram and ECDF
ozone <- airquality$Ozone
m <- mean(ozone, na.rm = TRUE)
v <- var(ozone, na.rm = TRUE)
plotFdist(ozone,
hist = list(breaks = 15),
curve = list(expr = "dgamma(x, shape = m^2/v, scale = v/m)",
col = "navajowhite3"),
curveEcdf = list(expr = "pgamma(x, shape = m^2/v, scale = v/m)",
col = "navajowhite3"),
main = "Airquality - Ozone")
# overlay gamma distribution on both histogram and ECDF
ozone <- airquality$Ozone
m <- mean(ozone, na.rm = TRUE)
v <- var(ozone, na.rm = TRUE)
plotFdist(ozone,
hist = list(breaks = 15),
curve = list(expr = "dgamma(x, shape = m^2/v, scale = v/m)",
col = "navajowhite3"),
curveEcdf = list(expr = "pgamma(x, shape = m^2/v, scale = v/m)",
col = "navajowhite3"),
main = "Airquality - Ozone")