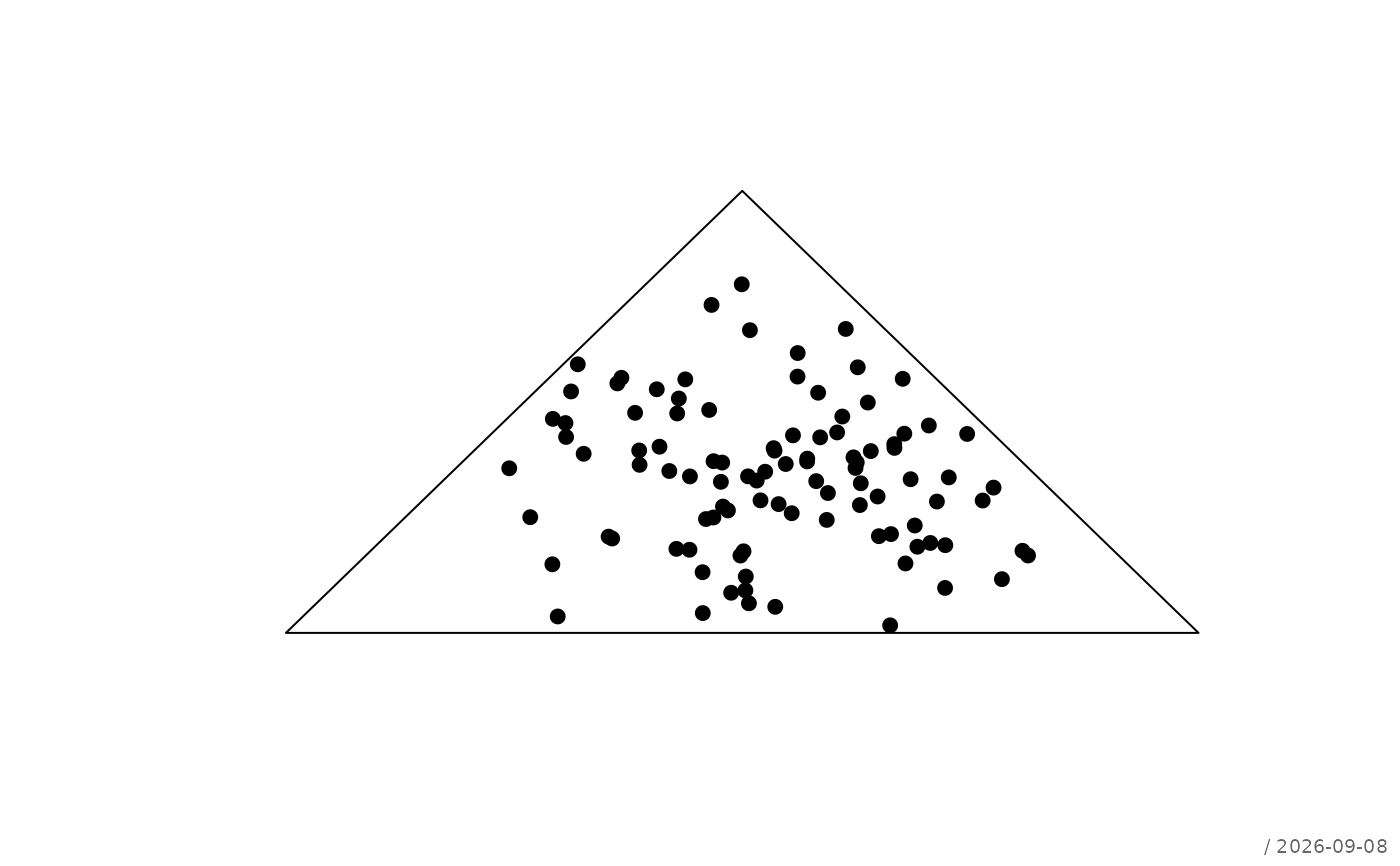
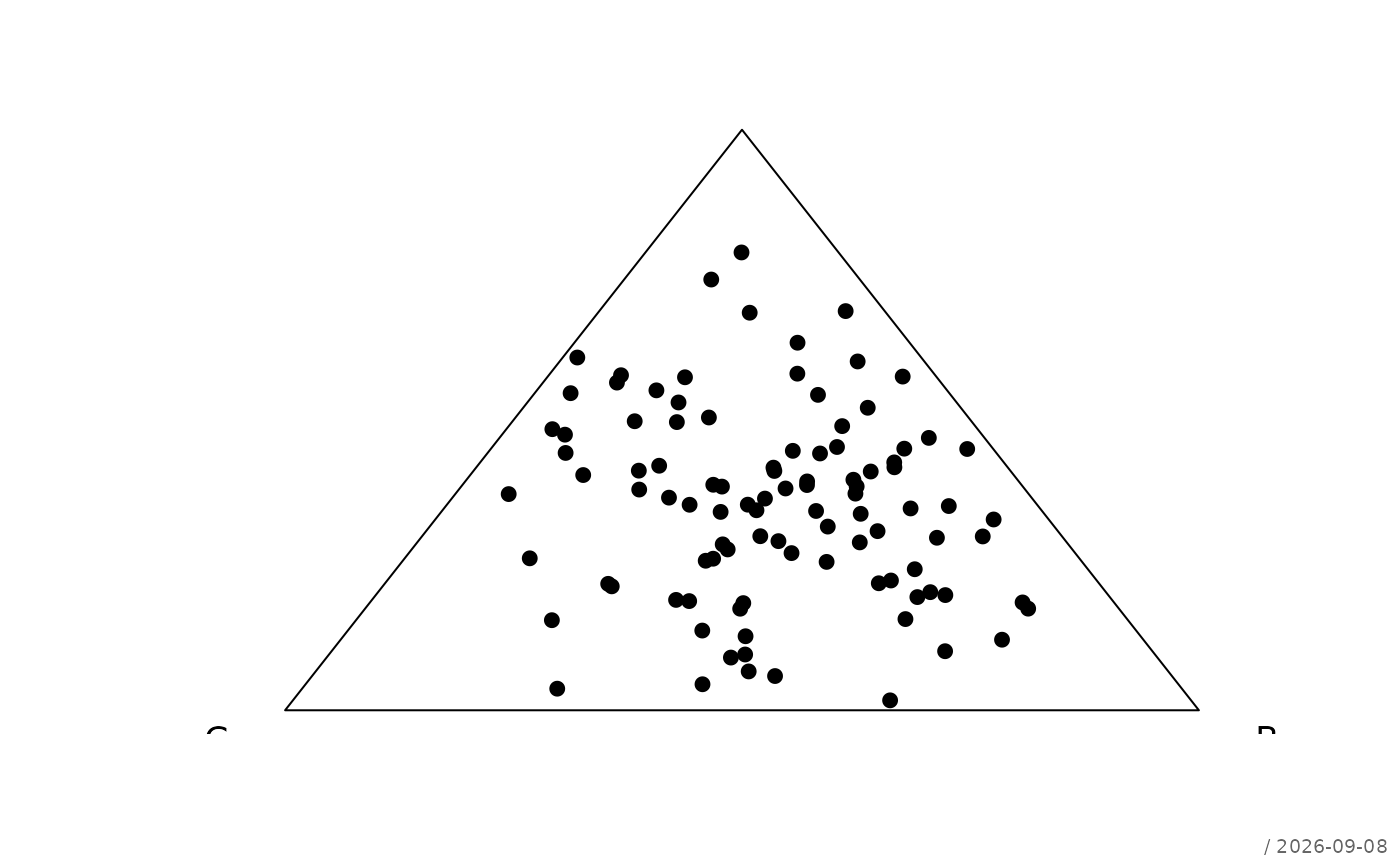
Draws a ternary plot for compositional data consisting of three non-negative components per observation. Each row is interpreted as a composition and internally rescaled to sum to 1 if necessary.
Arguments
- x
A numeric vector, matrix, or data frame. If
yandzare provided,x,y, andzare combined into a matrix. Otherwise,xmust contain exactly three columns.- y
optional numeric vector for the second component.
- z
optional numeric vector for the third component.
- main
plot title.
- xlim, ylim
plot limits (usually left at defaults).
- add
logical; if
TRUE, adds to an existing plot.- col
point color(s).
- pch
plotting symbol.
- cex
point size.
- grid
logical,
NA, or list controlling the ternary grid.- labels
character vector of length 3 specifying axis labels.
- stamp
controls the corner stamp.
.useTheme(default) resolves togetTheme()$stamp.TRUE/FALSE/NULL, a string, or a named list forstamp().- ...
additional graphical parameters passed to
par().
Details
A ternary plot represents three-part compositions on an equilateral triangle. Each observation \((x_1, x_2, x_3)\) is mapped to 2D coordinates using barycentric transformation. If rows do not sum to 1, they are automatically normalized with a warning.
Graphical elements such as grids are controlled via the unified plot
design system using bedrock::callIf() and .theme().
See also
Other plot.special:
plotBinaryTree(),
plotCirc(),
plotLift(),
plotMiss(),
plotPolar(),
plotPropCI(),
plotSankey(),
plotTimeSeries(),
plotTreemap(),
plotWeb()