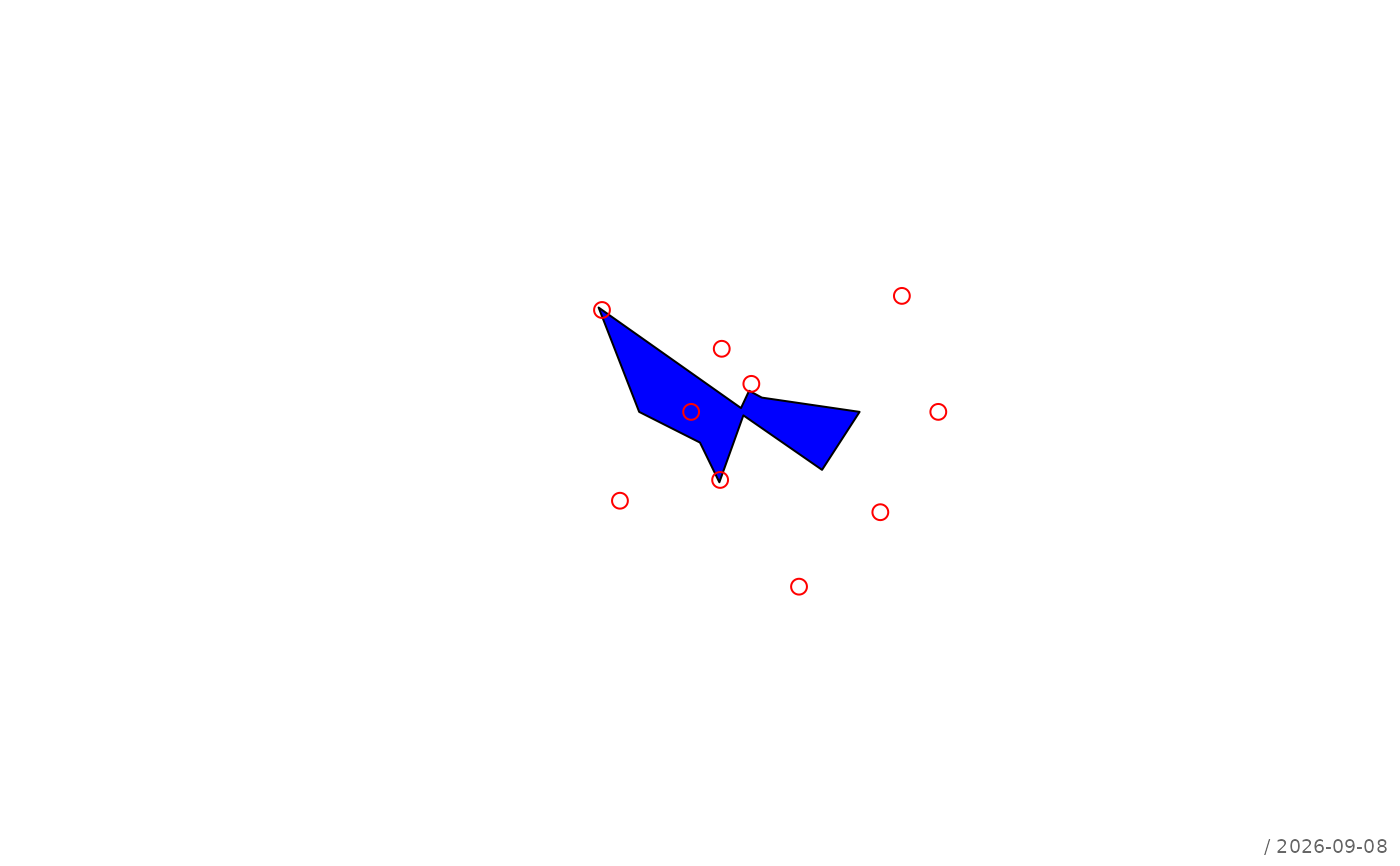
Creates a polar coordinate plot for one or multiple radial series.
Usage
plotPolar(
  r,
  theta = NULL,
  main = NULL,
  rlim = NULL,
  type = "p",
  add = FALSE,
  col = NULL,
  border = NULL,
  stamp = .useTheme,
  ...
)
Arguments
- r
numeric vector or matrix of radial values. Each row represents one series.
- theta
optional numeric vector or matrix of angles (in radians). Must match the dimensions of
r. IfNULL, equally spaced angles are used.- main
optional plot title.
- rlim
numeric limit for radial axis. If
NULL, determined automatically.- type
character vector specifying plot type for each series:
- "p"
points
- "l"
polygon (connected and optionally filled)
- "h"
radial segments ("histogram"-style)
- add
logical; if
TRUE, adds to an existing plot.- col
color for points/lines.
- border
color for border in case of type
polygon.- stamp
controls the corner stamp.
.useTheme(default) resolves togetTheme()$stamp.TRUE/FALSE/NULL, a string, or a named list forstamp().- ...
additional graphical parameters passed to base plotting functions.
Details
The function supports plotting multiple radial series simultaneously.
Each row of r is treated as a separate series.
Angles are interpreted in radians. If theta is not provided,
points are distributed evenly over \([0, 2\pi)\).
Graphical parameters such as lwd, lty, pch,
cex, fill, and mar can be passed via ....
See also
Other plot.special:
plotBinaryTree(),
plotCirc(),
plotLift(),
plotMiss(),
plotPropCI(),
plotSankey(),
plotTernary(),
plotTimeSeries(),
plotTreemap(),
plotWeb()