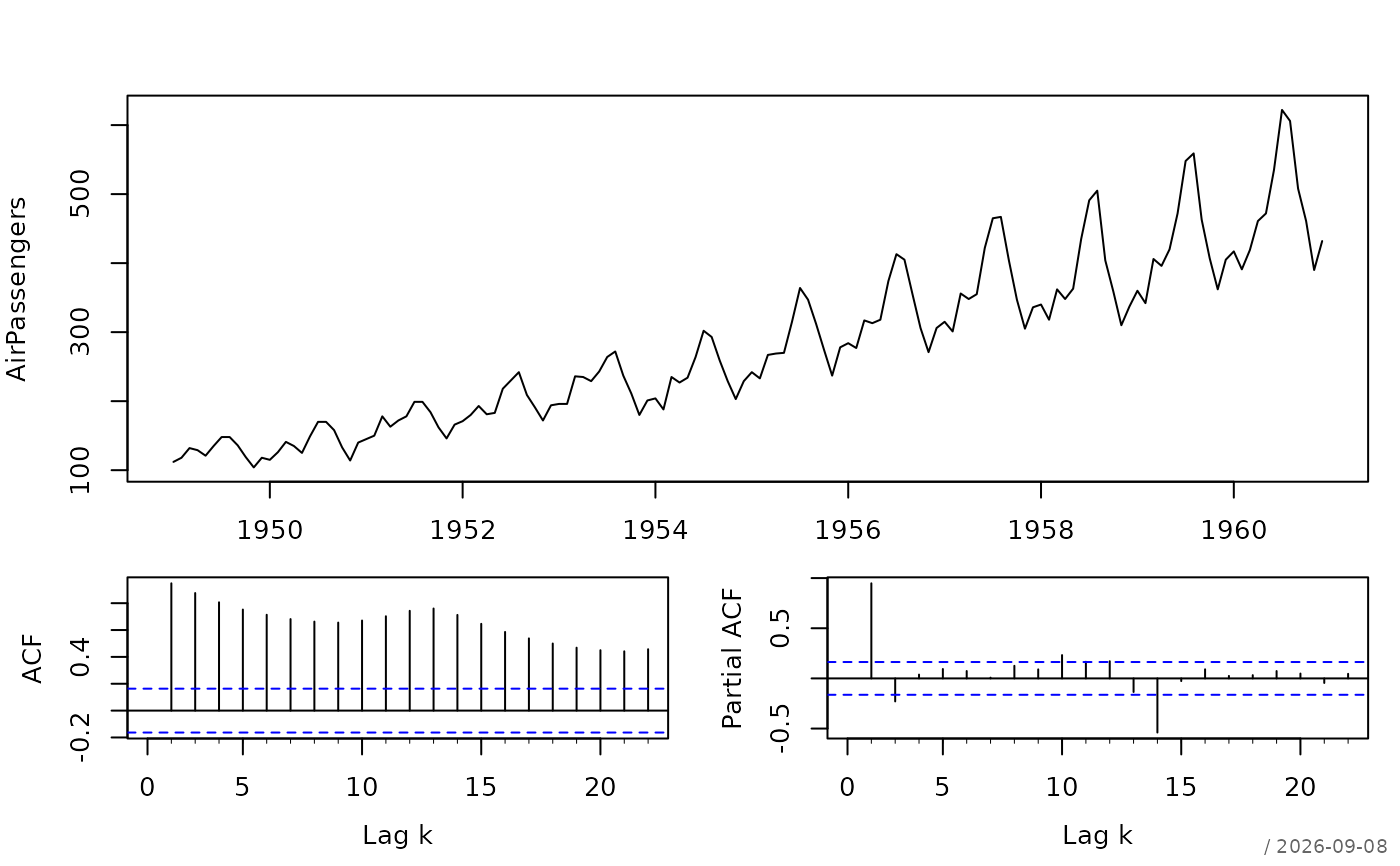
Combined plot of a time Series and its autocorrelation and partial autocorrelation
Arguments
- x
univariate time series.
- main
an overall title for the plot
- ylab
a title for the y axis: see
title().- maxLag
integer. Defines the number of lags to be displayed. The default is 10 * log10(length(series)).
- stamp
controls the corner stamp.
.useTheme(default) resolves togetTheme()$stamp.TRUE/FALSE/NULL, a string, or a named list forstamp().- ...
the dots are passed to the plot command.
Details
plotTimeSeries plots a combination of the time series and its autocorrelation and partial autocorrelation.
See also
Other plot.special:
plotBinaryTree(),
plotCirc(),
plotLift(),
plotMiss(),
plotPolar(),
plotPropCI(),
plotSankey(),
plotTernary(),
plotTreemap(),
plotWeb()