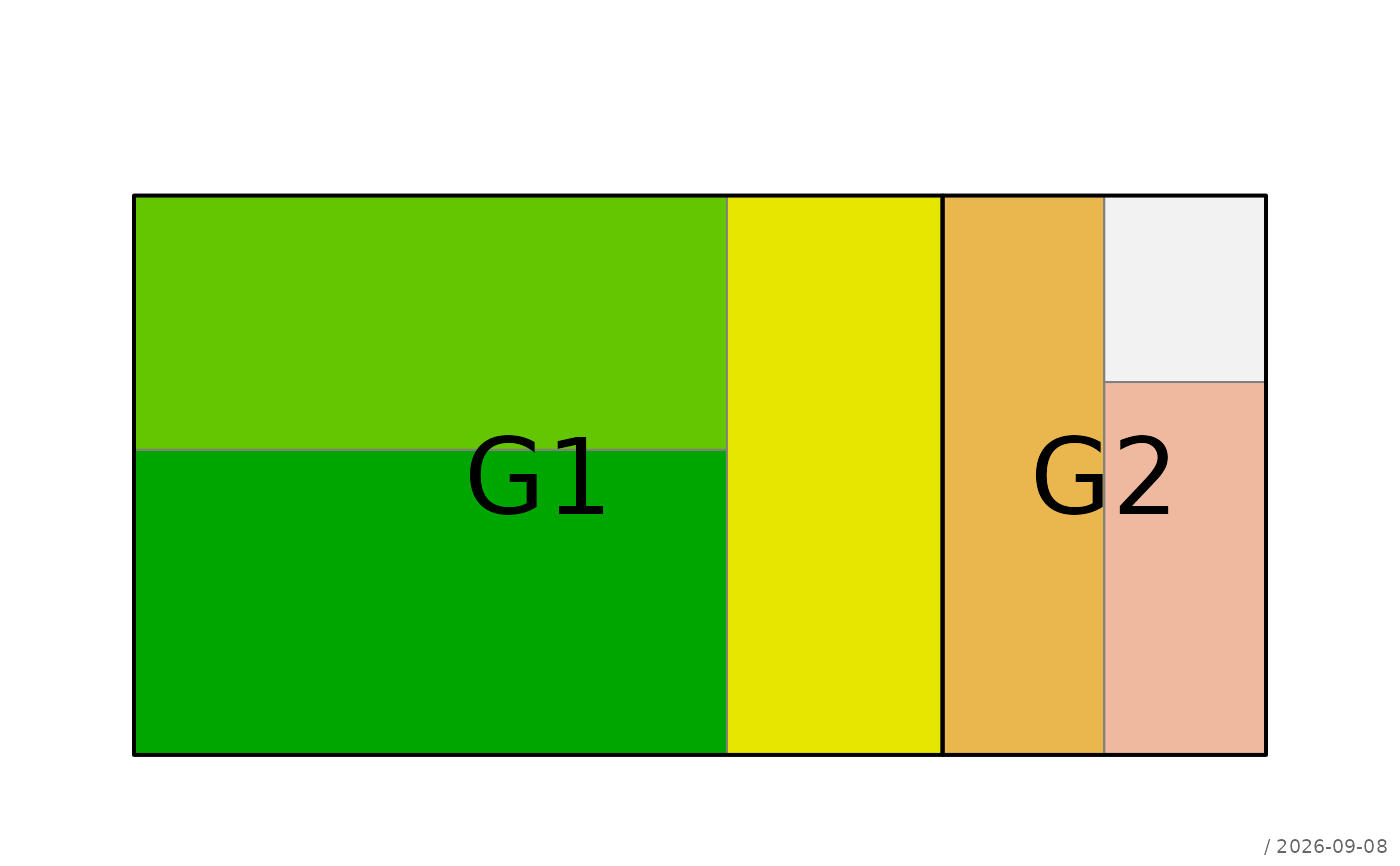
Draws a treemap in which the area of each rectangle is proportional to the
corresponding value in x. Optionally, rectangles can be grouped into
higher-level regions.
Usage
plotTreemap(
  x,
  groups = NULL,
  main = NULL,
  area = NULL,
  labels = NULL,
  stamp = .useTheme,
  ...
)
Arguments
- x
numeric vector of positive values determining the rectangle sizes.
- groups
optional grouping variable. Values sharing the same group are placed within a common enclosing region. A list sets the appearance of the group regions as well: it holds the grouping variable (element
by, or the one unnamed element) and the elementsareaandlabels, which follow the conventions of the argumentsareaandlabels, e.g.groups = list(grp, area = list(border = "black", lwd = 2)). By default, group names are used as labels when more than one group is present.- main
main title of the plot.
- area
controls the appearance of individual rectangles.
NULLorTRUE: use defaults.FALSEorNA: suppress rectangle fill.Atomic vector: interpreted as
col.List: graphical parameters such as
col,border, andlwd.
- labels
controls the labels of individual rectangles.
NULLorTRUE: use default labels (names(x)).FALSEorNA: suppress labels.Character vector: interpreted as label text.
List: label properties such as
text,col, andcex.
- stamp
controls the corner stamp.
.useTheme(default) resolves togetTheme()$stamp.TRUE/FALSE/NULL, a string, or a named list forstamp().- ...
additional graphical parameters passed to
.applyParFromDots().
Value
Invisibly returns a list containing the coordinates of group centres and the centres of their child rectangles.
Details
The appearance of individual rectangles is controlled through the
area and labels arguments, that of the groups through the elements
area and labels of a groups list. These accept logical values,
vectors, or lists.
Individual rectangles are sized according to the values in x. When
groups is supplied, a treemap is first constructed for the groups,
and each group's area is then subdivided among its members.
The arguments area and labels - and their counterparts in a
groups list - provide a flexible interface for controlling the
appearance of the plot while keeping the main function signature compact.
See also
Other plot.special:
plotBinaryTree(),
plotCirc(),
plotLift(),
plotMiss(),
plotPolar(),
plotPropCI(),
plotSankey(),
plotTernary(),
plotTimeSeries(),
plotWeb()
Examples
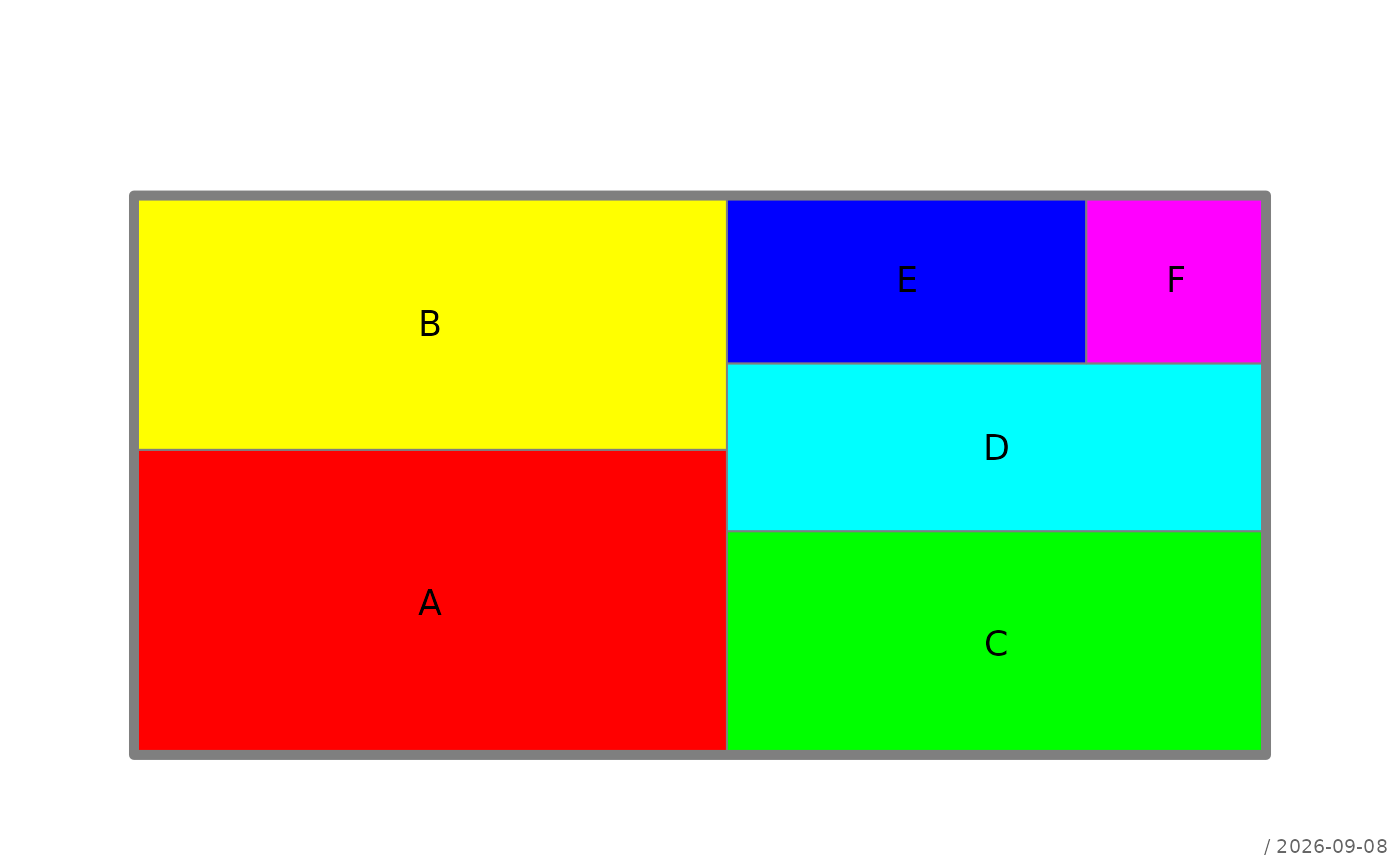
x <- c(A = 6, B = 5, C = 4, D = 3, E = 2, F = 1)
plotTreemap(x)
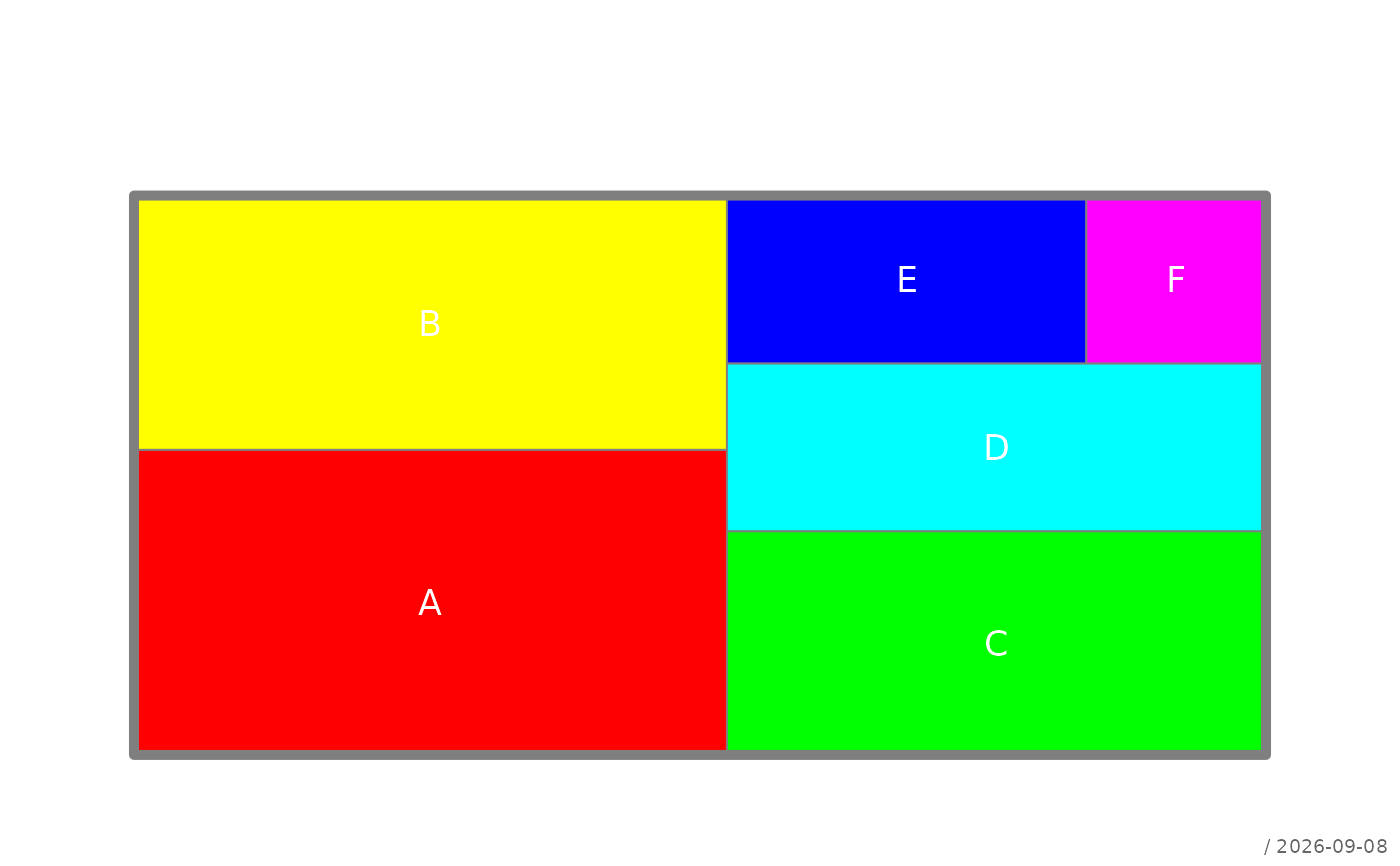
 plotTreemap(
x,
labels = list(col = "white")
)
plotTreemap(
x,
labels = list(col = "white")
)
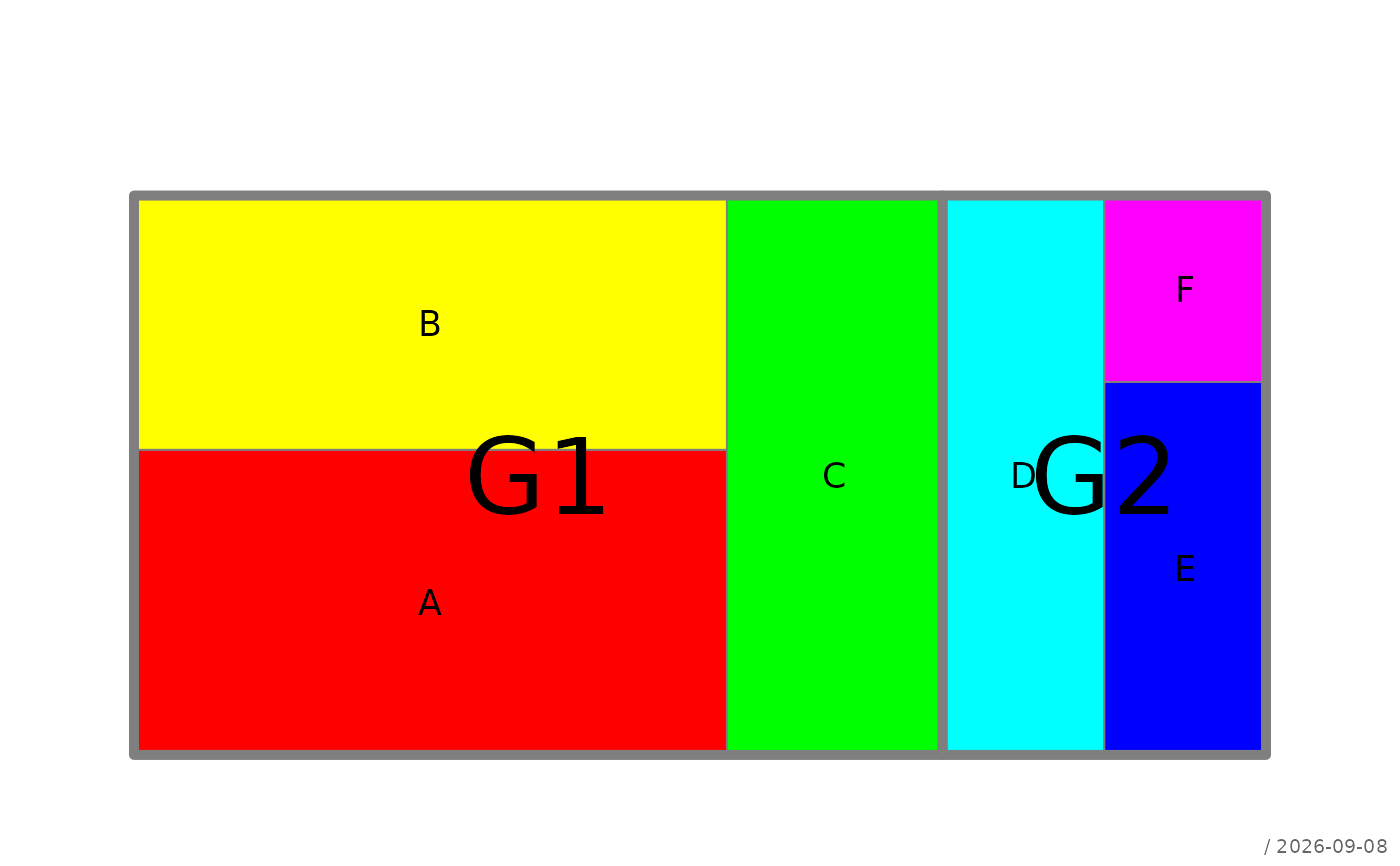
 grp <- c("G1", "G1", "G1", "G2", "G2", "G2")
plotTreemap(
x,
groups = list(grp, labels = TRUE)
)
grp <- c("G1", "G1", "G1", "G2", "G2", "G2")
plotTreemap(
x,
groups = list(grp, labels = TRUE)
)
 plotTreemap(
x,
groups = list(grp, area = list(border = "black", lwd = 2)),
area = terrain.colors(length(x)),
labels = FALSE
)
plotTreemap(
x,
groups = list(grp, area = list(border = "black", lwd = 2)),
area = terrain.colors(length(x)),
labels = FALSE
)