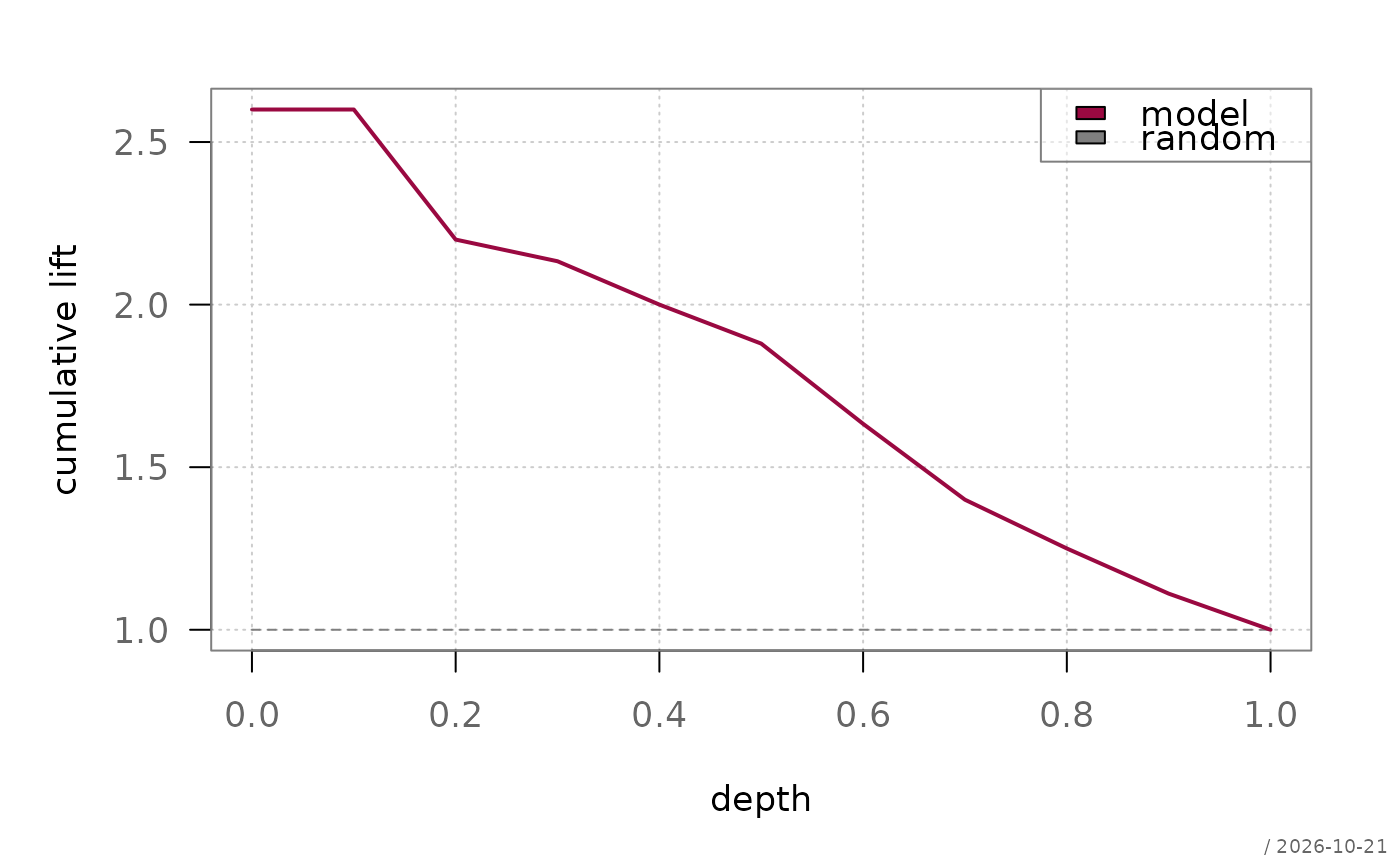
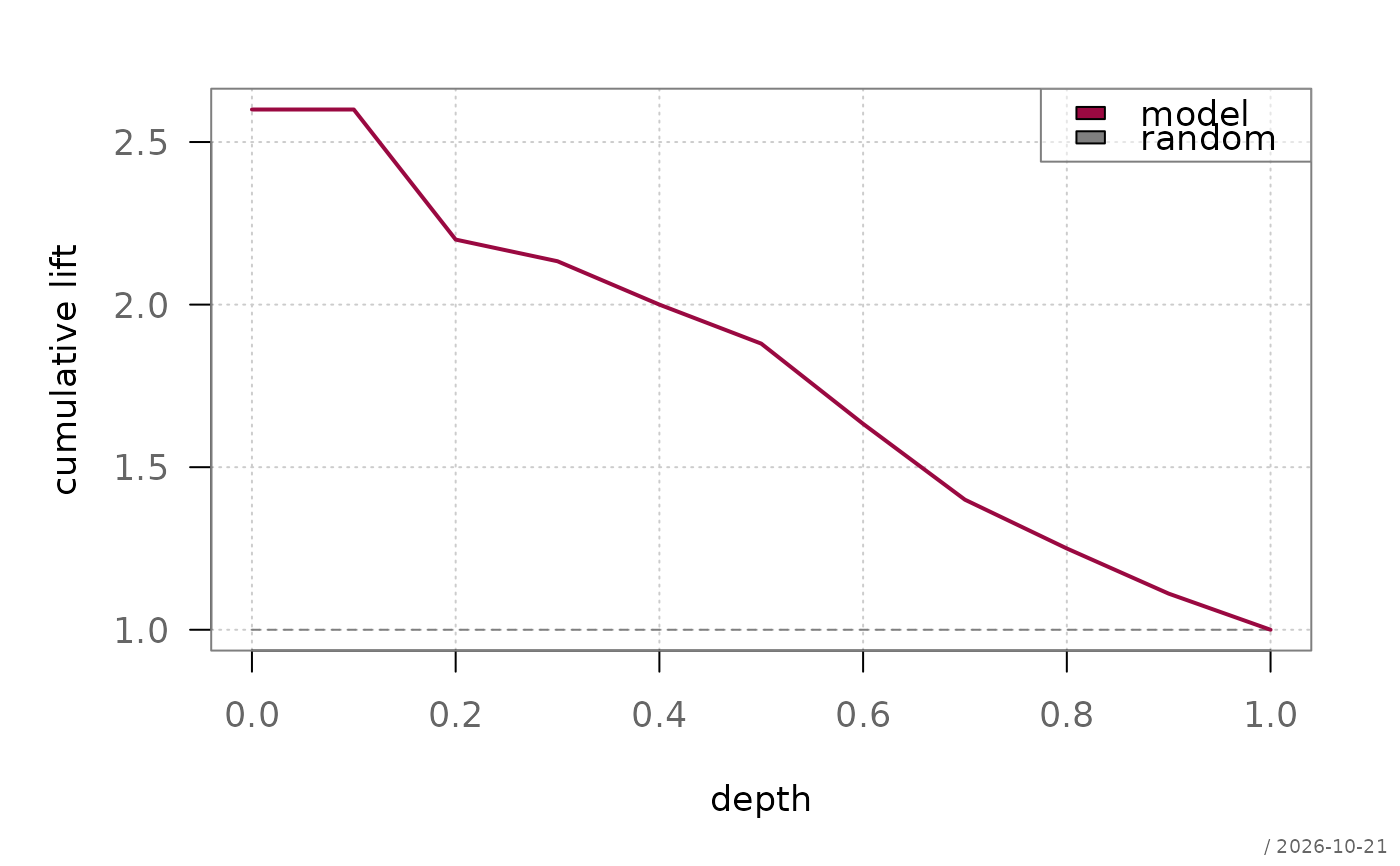
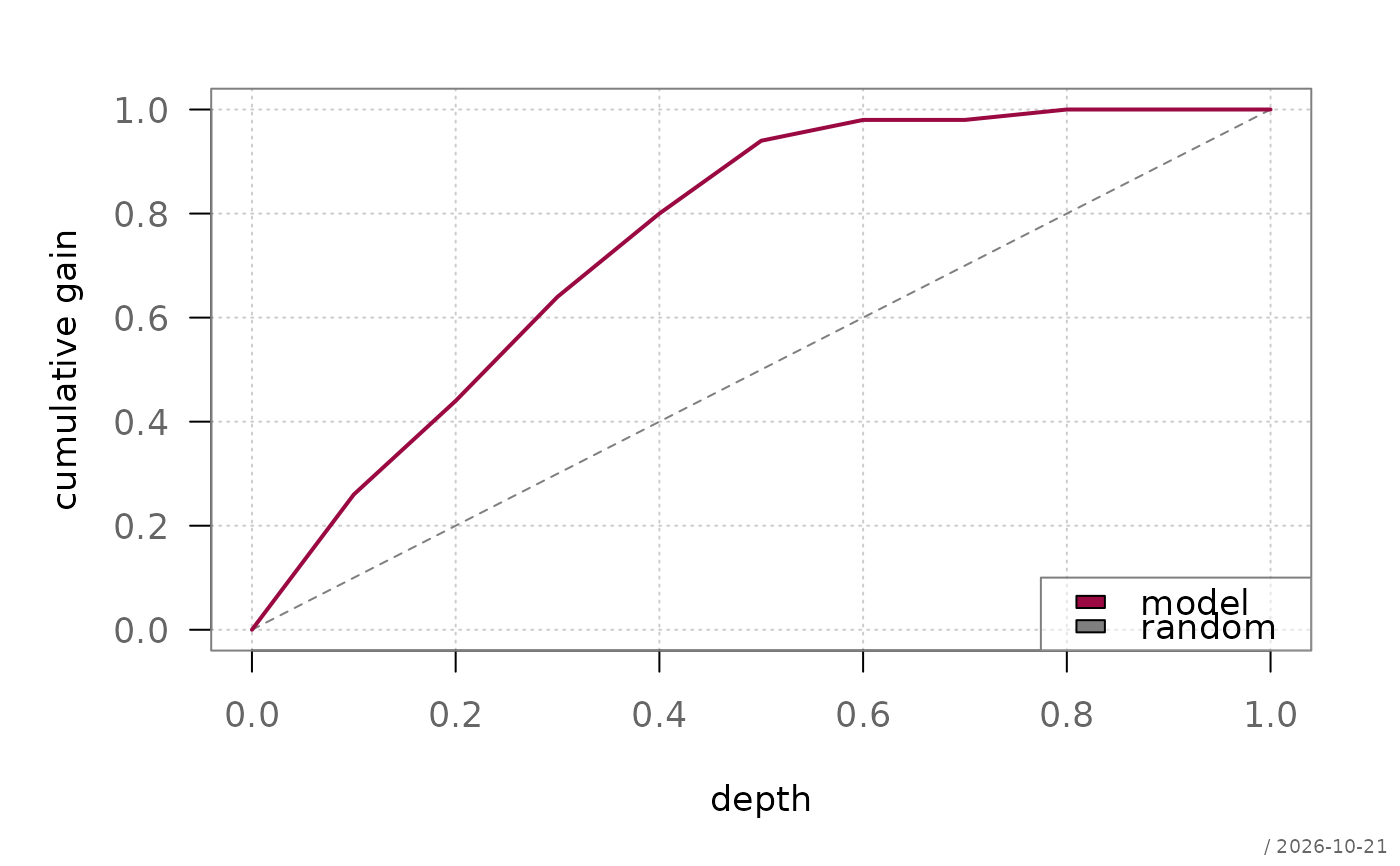
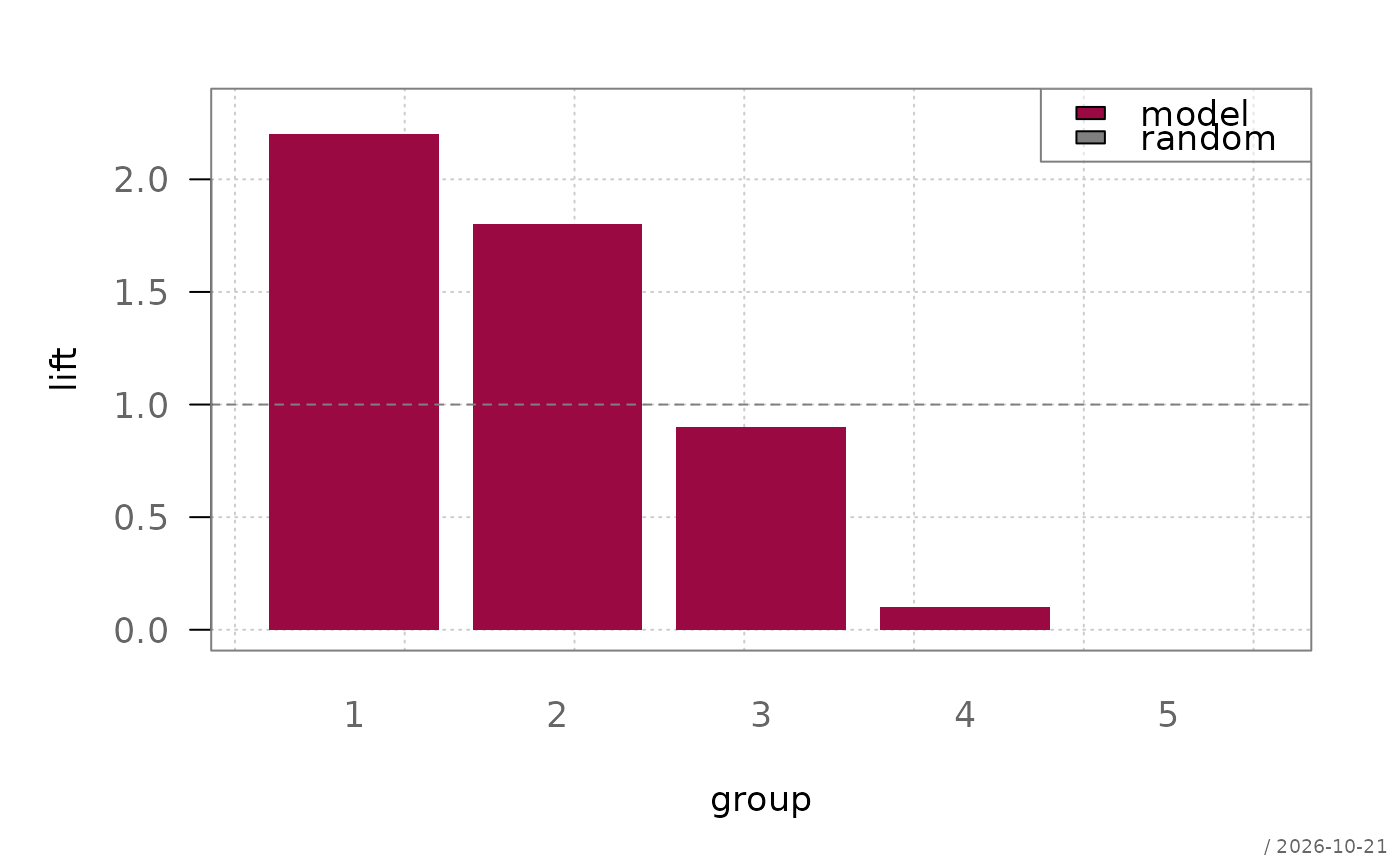
Draws the cumulative lift curve, the cumulative gain curve, or the per-group lift bars of a binary classifier, together with the baseline of a random model. The chart answers the operational question directly: how much better is acting on the top-scored share of the cases than acting on a random share of the same size.
Usage
plotLift(
  x,
  main = NULL,
  xlab = NULL,
  ylab = NULL,
  ylim = NULL,
  type = c("cumulative", "gain", "decile"),
  col = .useTheme,
  lwd = 2,
  grid = .useTheme,
  box = .useTheme,
  baseline = TRUE,
  perfect = FALSE,
  legend = TRUE,
  stamp = .useTheme,
  ...
)
Arguments
- x
an object of class
"Lift", as returned byalloy::lift().- main
main title.
NULL(default) draws none, unless the theme setsautoTitle = TRUE(see theme); the title is then derived from the expression passed asx."",NAorFALSEalways suppress it and compact the top margin; any other string is used as given.- xlab
label for the x-axis.
NULL(default) derives a label fromtype.- ylab
label for the y-axis.
NULL(default) derives a label fromtype.- ylim
numeric vector of length 2; y-axis limits.
NULL(default) spans the curve together with the baseline.- type
the curve to draw. One of
"cumulative"(cumulative lift over depth, the default),"gain"(share of all positives captured, over depth), or"decile"(per-group lift as bars).- col
color of the curve or the bars.
.useTheme(default) resolves togetTheme()$twin[1]- a single accent color, consistent withplotECDF().- lwd
line width of the curve. Has no effect for
type = "decile".- grid
controls drawing of the background grid. Can be:
.useTheme(default): follow the active theme (getTheme()$grid)TRUE: draw grid with theme settingsFALSE,NULL, orNA: suppress grida named list: arguments passed to
graphics::grid(), overriding the theme defaults for this call only
- box
controls drawing of the plot box.
.useTheme(default) resolves togetTheme()$box.TRUE/FALSE/NA, or a named list, as forgrid.- baseline
controls the reference line of a random model - a horizontal line at 1 for
type = "cumulative"and"decile", the diagonal fortype = "gain". Can be:TRUE(default): draw with default settingsFALSE,NULL, orNA: suppressa named list: arguments passed to
graphics::lines()(orgraphics::abline()fortype = "decile"), e.g.list(col = "black", lty = "dotted")
- perfect
controls the curve of a perfect ranking - the theoretical maximum attainable at each depth, given the base rate.
FALSEby default, since it compresses the interesting part of the y-axis;TRUEor a named list to draw it, as forbaseline. Has no effect fortype = "decile".- legend
controls drawing of the legend. Can be:
TRUE(default): draw with default settingsFALSE,NULL, orNA: suppressa named list: arguments passed to
graphics::legend(), e.g.list(x = "bottomleft")
- stamp
controls the corner stamp.
.useTheme(default) resolves togetTheme()$stamp.TRUE/FALSE/NULL, a string, or a named list of arguments forstamp().- ...
further graphical parameters passed to
par()via the internal framework.
Details
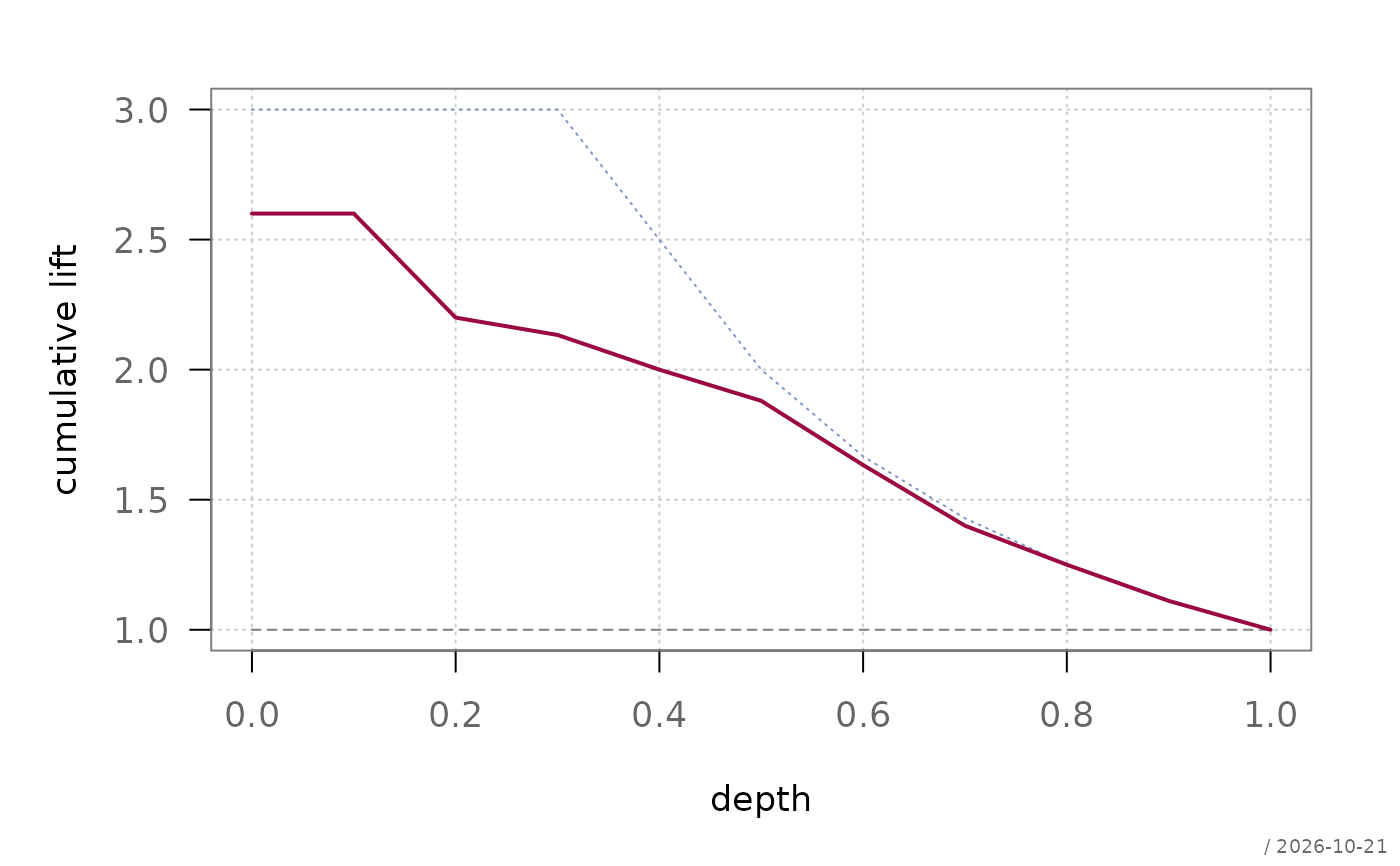
Reading the cumulative curve at depth 0.2 gives the factor by which contacting the top-scored fifth of the cases beats contacting a random fifth. The gain variant answers the complementary question - what share of all positives that fifth captures.
The curve necessarily converges to 1 (cumulative lift) or to the diagonal endpoint (gain) at depth 1, where all cases are selected and the model no longer discriminates. Only the left part of the curve carries decision value: a model that separates well over the first two deciles and poorly afterwards is preferable for a small campaign to one with the reverse profile and identical AUC.
Optional plot components (grid, box, baseline,
perfect, legend) follow bedrock::callIf()
semantics:
TRUE: draw with defaultsFALSE,NULL, orNA: suppress componentnamed list: customize component arguments
col, grid, box, and stamp default to
.useTheme, deferring to the package's active theme (see theme)
rather than a hardcoded value.
The number of groups is a property of the lift table, not of the plot -
set it via the nBins argument of alloy::lift().
See also
alloy::lift(), alloy::roc(), plotECDF(),
bedrock::callIf(), theme
Other plot.special:
plotBinaryTree(),
plotCirc(),
plotMiss(),
plotPolar(),
plotPropCI(),
plotSankey(),
plotTernary(),
plotTimeSeries(),
plotTreemap(),
plotWeb()
Examples
# A lift table is normally computed by alloy::lift(). To keep the example
# self-contained, the columns used by the plot are built by hand here:
# cases ranked by decreasing score and cut into equally sized groups.
liftTable <- function(score, y, nBins = 10) {
y <- y[order(score, decreasing = TRUE)]
bin <- cut(seq_along(y), nBins, labels = FALSE)
nObs <- as.vector(table(bin))
nPos <- as.vector(tapply(y, bin, sum))
structure(
data.frame(bin = seq_len(nBins),
lift = (nPos / nObs) / mean(y),
depth = cumsum(nObs) / length(y),
cumLift = (cumsum(nPos) / cumsum(nObs)) / mean(y),
gain = cumsum(nPos) / sum(y)),
class = c("Lift", "data.frame"),
baseRate = mean(y))
}
y <- as.integer(iris$Species == "virginica")
fit <- glm(y ~ Sepal.Length + Sepal.Width, data = iris, family = binomial)
lft <- liftTable(fitted(fit), y)
plotLift(lft)
 plotLift(lft, type = "gain")
 # Per-group bars, coarser grouping set at computation time
plotLift(liftTable(fitted(fit), y, nBins = 5), type = "decile")
# Per-group bars, coarser grouping set at computation time
plotLift(liftTable(fitted(fit), y, nBins = 5), type = "decile")
 # Add the perfect-ranking reference, suppress the legend
plotLift(lft, perfect = TRUE, legend = FALSE)
# Add the perfect-ranking reference, suppress the legend
plotLift(lft, perfect = TRUE, legend = FALSE)
 # No title, compact top margin
plotLift(lft, main = "")
# No title, compact top margin
plotLift(lft, main = "")