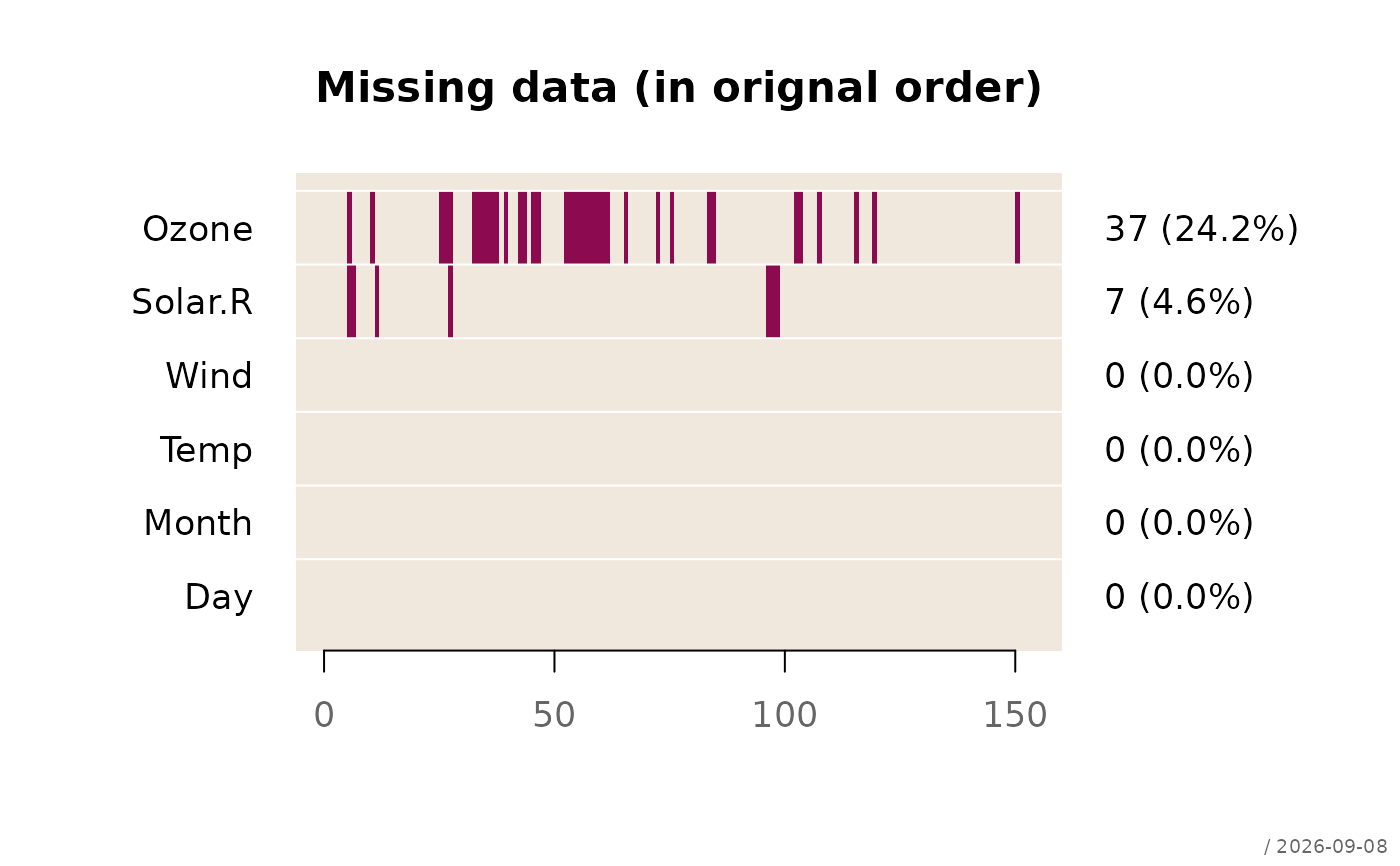
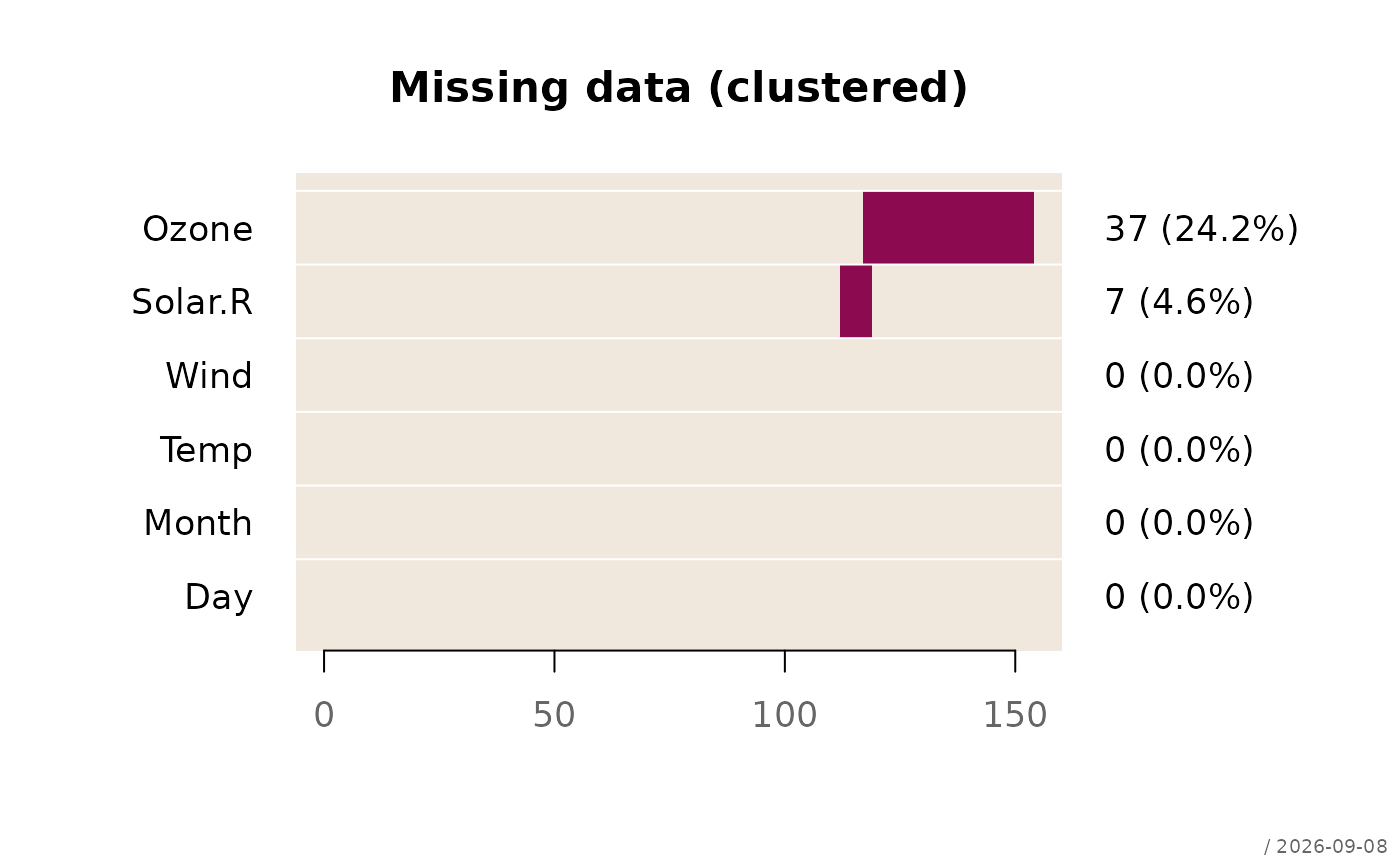
Takes a data frame and displays the location of missing data. The missings can be clustered and be displayed together.
Usage
plotMiss(
  x,
  main = NULL,
  cluster = FALSE,
  col = "deeppink4",
  bg = fade("navajowhite3", 0.3),
  stamp = .useTheme,
  ...
)
Arguments
- x
a data.frame to be analysed.
- main
main title.
NULL(default) draws none, unless the theme setsautoTitle = TRUE(see theme); the title is then derived from the expression passed asx."",NAorFALSEalways suppress it and compact the top margin; any other string is used as given.- cluster
logical, defining if the missings should be clustered. Default is
FALSE.- col
the colour of the missings.
- bg
the background colour of the plot.
- stamp
controls the corner stamp.
.useTheme(default) resolves togetTheme()$stamp.TRUE/FALSE/NULL, a string, or a named list forstamp().- ...
the dots are passed to
plot().
Details
A graphical display of the position of the missings can be help to detect dependencies or patterns within the missings.
Note
Following an idea of Henk Harmsen henk@carbonmetrics.com
See also
hclust(), bedrock::countCompCases()
Other plot.special:
plotBinaryTree(),
plotCirc(),
plotLift(),
plotPolar(),
plotPropCI(),
plotSankey(),
plotTernary(),
plotTimeSeries(),
plotTreemap(),
plotWeb()