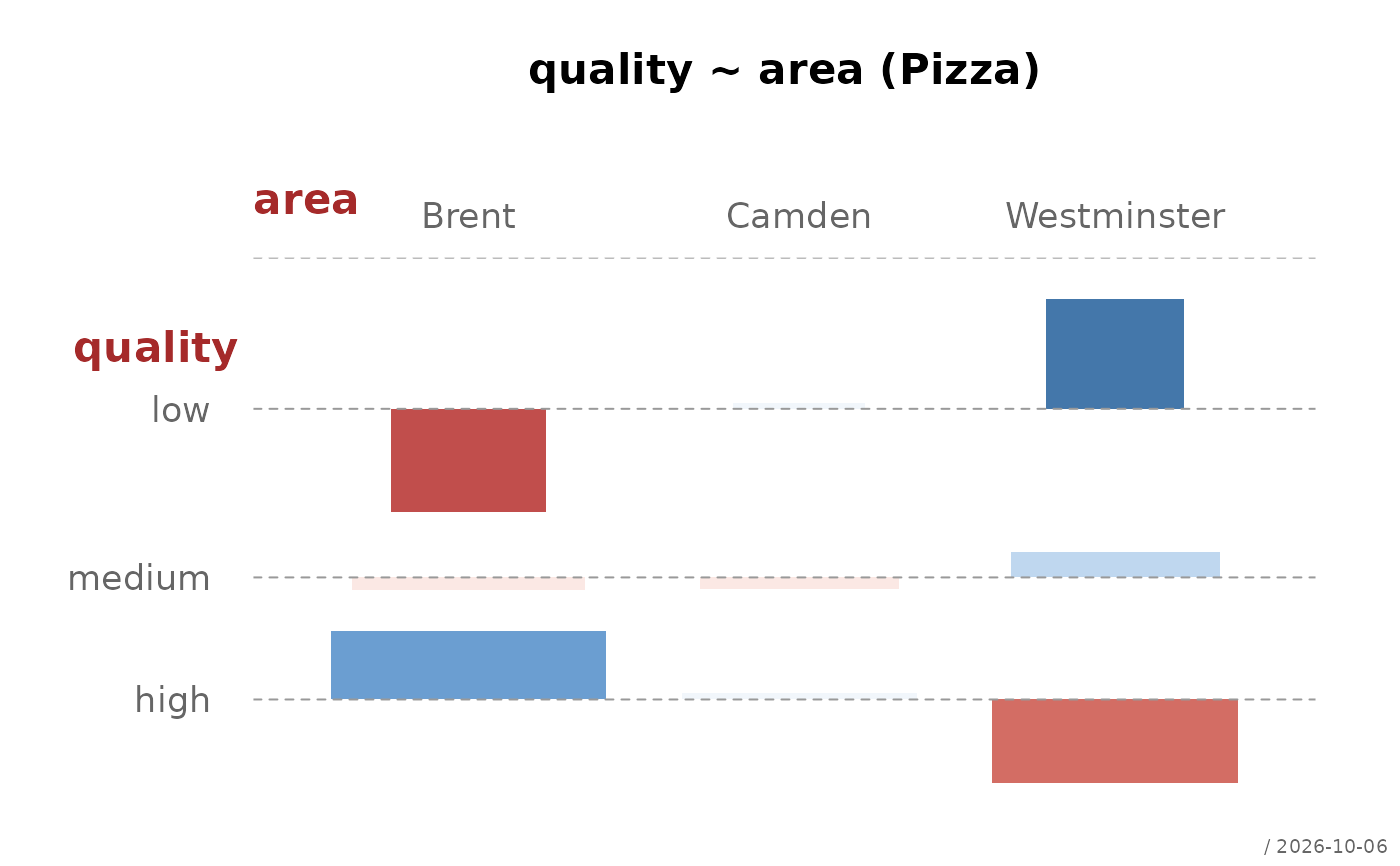
Computes, prints and plots descriptive statistics for the relationship
between two categorical variables x and y. The function is
dispatched automatically by desc(y ~ x, data) when both variables
are categorical.
Arguments
- x
a categorical variable for
.descQQ(), or an object of class"Desc.qq"for the print and plot methods- digits
currently unused
- ...
further arguments. In
.descQQ()passed todesc(), inprint()toprint.Desc.table(), inplot()topharos::plot.Desc.table().- main
main title for the plot; defaults to the title stored in
x$meta$main- which
integer vector selecting the plots to draw, passed on to
pharos::plot.Desc.table(), see section Plots. Default1.- y
a categorical variable
Value
.descQQ() returns an object of class c("Desc.qq", "Desc").
The plot method returns the value of pharos::plot.Desc.table().
Details
This function is a wrapper around desc.table() applied to
the contingency table table(x, y).
It summarizes the joint distribution of two categorical variables and provides association measures and visualizations.
Computed statistics
Contingency table
Row and column percentages
Association measures (e.g., Cramer's V, Phi)
Optional statistical tests depending on configuration
Implementation note
Internally, desc.qq(x, y) is equivalent to:
Plots
plot() labels the table dimensions with the variable names and hands
over to pharos::plot.Desc.table(), the plot method for contingency
tables. Its help page documents the displays selected by which and
all further arguments; the displays themselves are drawn by
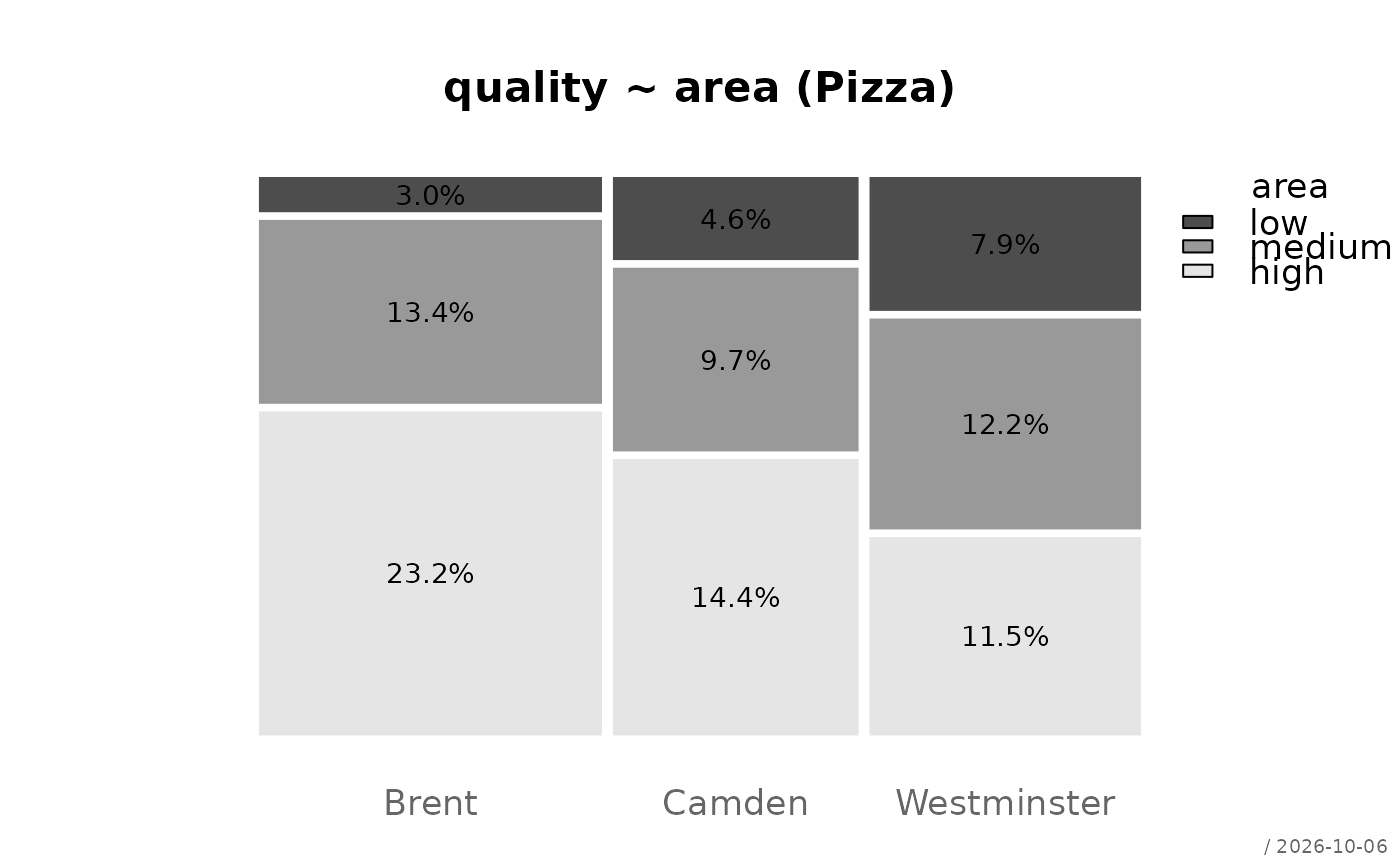
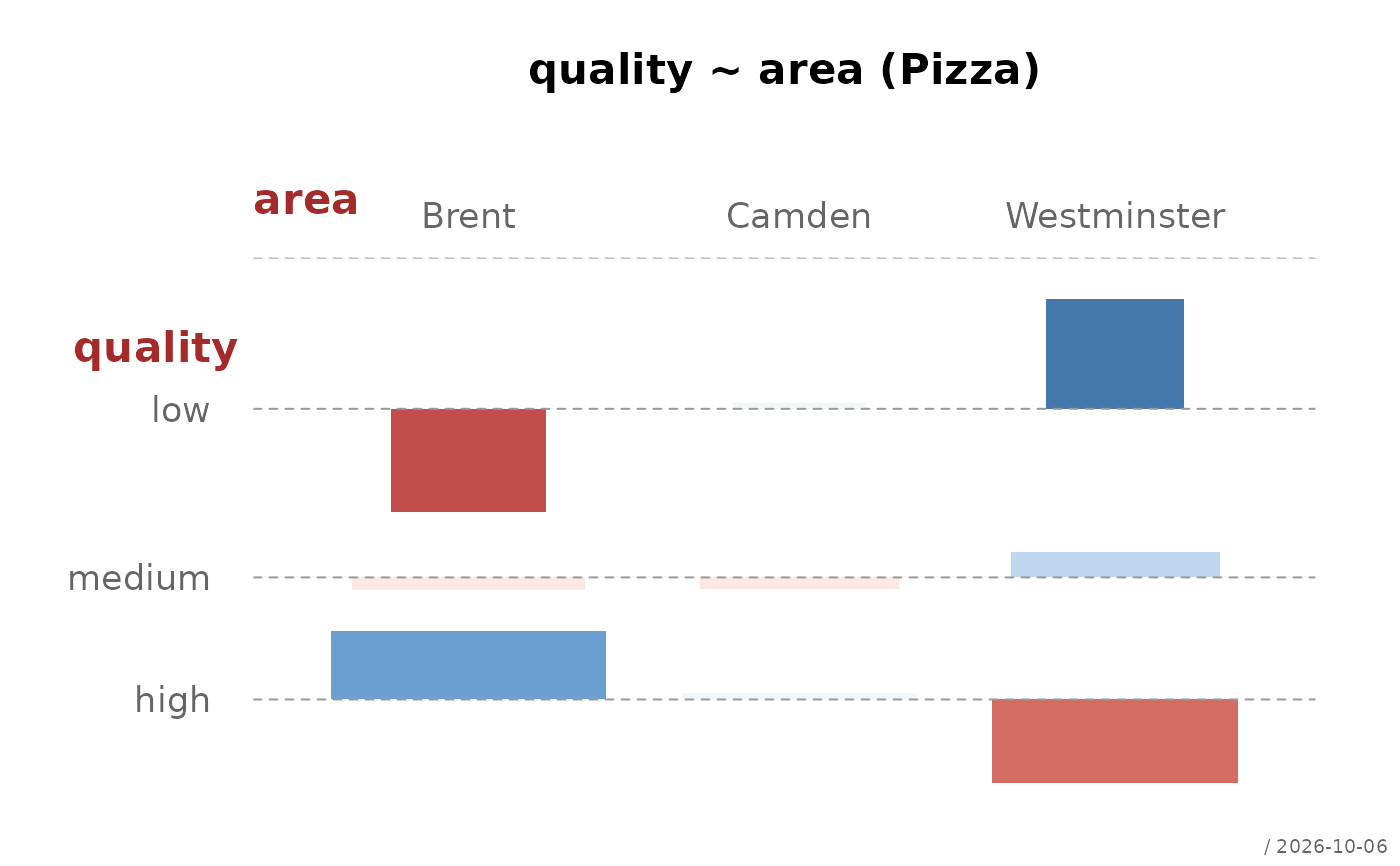
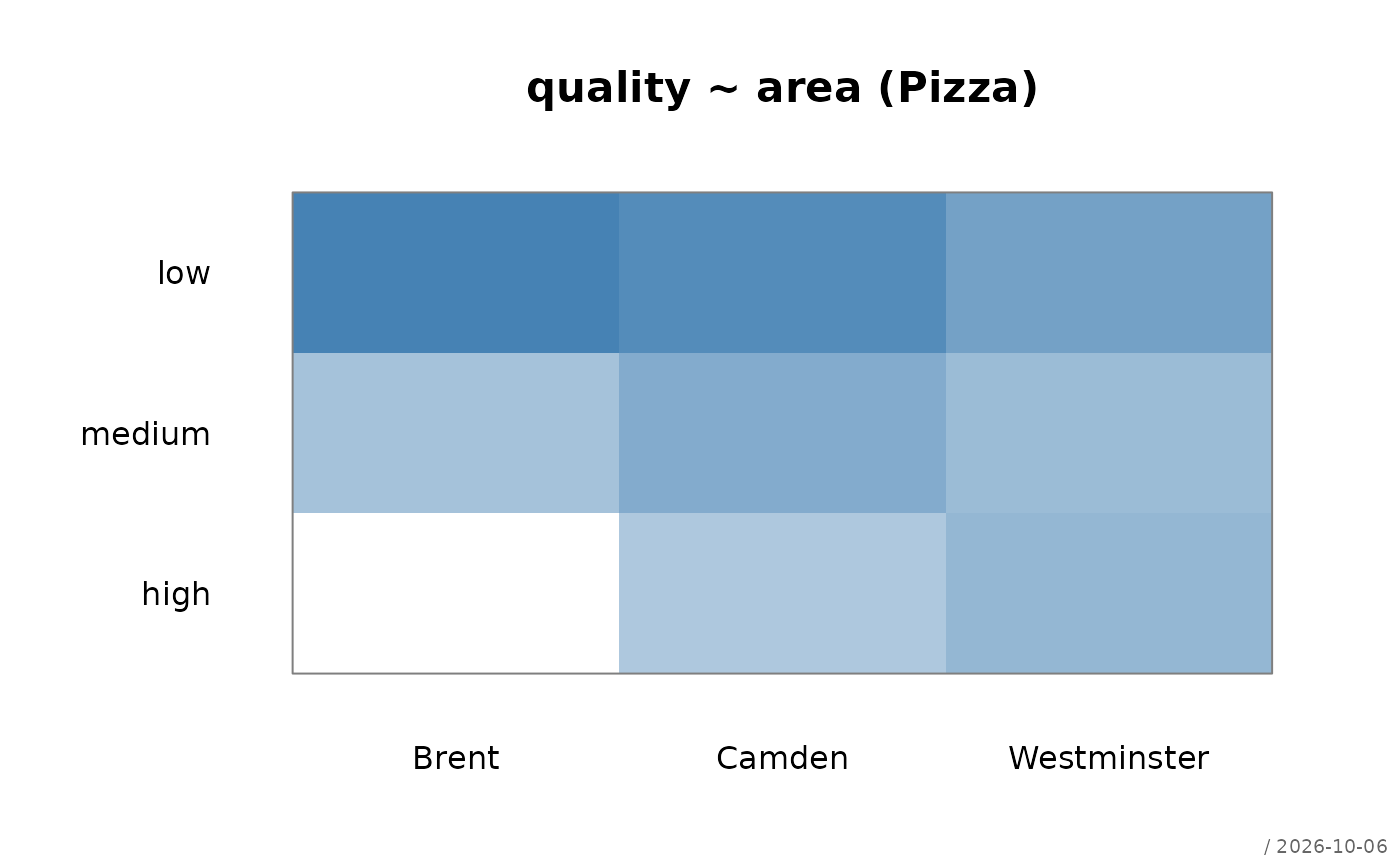
pharos::plotMosaic(), pharos::plotAssoc() and
pharos::plotHeatmap(), among others.
main defaults to the title stored in the object.
See also
desc(), desc.table(),
desc.qn(), desc.nq(), desc.nn()
Plot method: pharos::plot.Desc.table()
Other desc:
desc(),
desc.Date(),
desc.factor(),
desc.nn,
desc.nq,
desc.numeric(),
desc.qn,
desc.table(),
desc.ts()
Examples
# basic usage via desc()
desc(quality ~ area, Pizza)
#> ──────────────────────────────────────────────────────────────────────────────
#> quality ~ area (Pizza) (Desc.qq)
#>
#> Summary:
#> pairs: 1209, valid: 999 (82.6%), missings: 210 (17.4%)
#>
#> Brent Camden Westminster Sum
#>
#> low freq 30 46 79 155
#> p.row 19.4% 29.7% 51.0% 15.5%
#>
#> medium freq 134 97 122 353
#> p.row 38.0% 27.5% 34.6% 35.3%
#>
#> high freq 232 144 115 491
#> p.row 47.3% 29.3% 23.4% 49.1%
#>
#> Sum freq 396 287 316 999
#> p.row 39.6% 28.7% 31.6% 100.0%
#>
#>
#> Pearson's Chi-squared test:
#> X-squared = 53.559, df = 4, p-value = 6.509e-11
#> Log likelihood ratio (G-test) test of independence:
#> G = 55.05, df = 4, p-value = 3.171e-11
#> Mantel-Haenszel Chi-squared:
#> X-squared = 51.341, df = 1, p-value = 7.762e-13
#>
#> Contingency Coeff. 0.226
#> Cramer V 0.164
#> Kendall Tau-b -0.196
#>
 # store result, print and plot separately
d <- desc(quality ~ area, Pizza, plotit = FALSE)
d
#> ──────────────────────────────────────────────────────────────────────────────
#> quality ~ area (Pizza) (Desc.qq)
#>
#> Summary:
#> pairs: 1209, valid: 999 (82.6%), missings: 210 (17.4%)
#>
#> Brent Camden Westminster Sum
#>
#> low freq 30 46 79 155
#> p.row 19.4% 29.7% 51.0% 15.5%
#>
#> medium freq 134 97 122 353
#> p.row 38.0% 27.5% 34.6% 35.3%
#>
#> high freq 232 144 115 491
#> p.row 47.3% 29.3% 23.4% 49.1%
#>
#> Sum freq 396 287 316 999
#> p.row 39.6% 28.7% 31.6% 100.0%
#>
#>
#> Pearson's Chi-squared test:
#> X-squared = 53.559, df = 4, p-value = 6.509e-11
#> Log likelihood ratio (G-test) test of independence:
#> G = 55.05, df = 4, p-value = 3.171e-11
#> Mantel-Haenszel Chi-squared:
#> X-squared = 51.341, df = 1, p-value = 7.762e-13
#>
#> Contingency Coeff. 0.226
#> Cramer V 0.164
#> Kendall Tau-b -0.196
#>
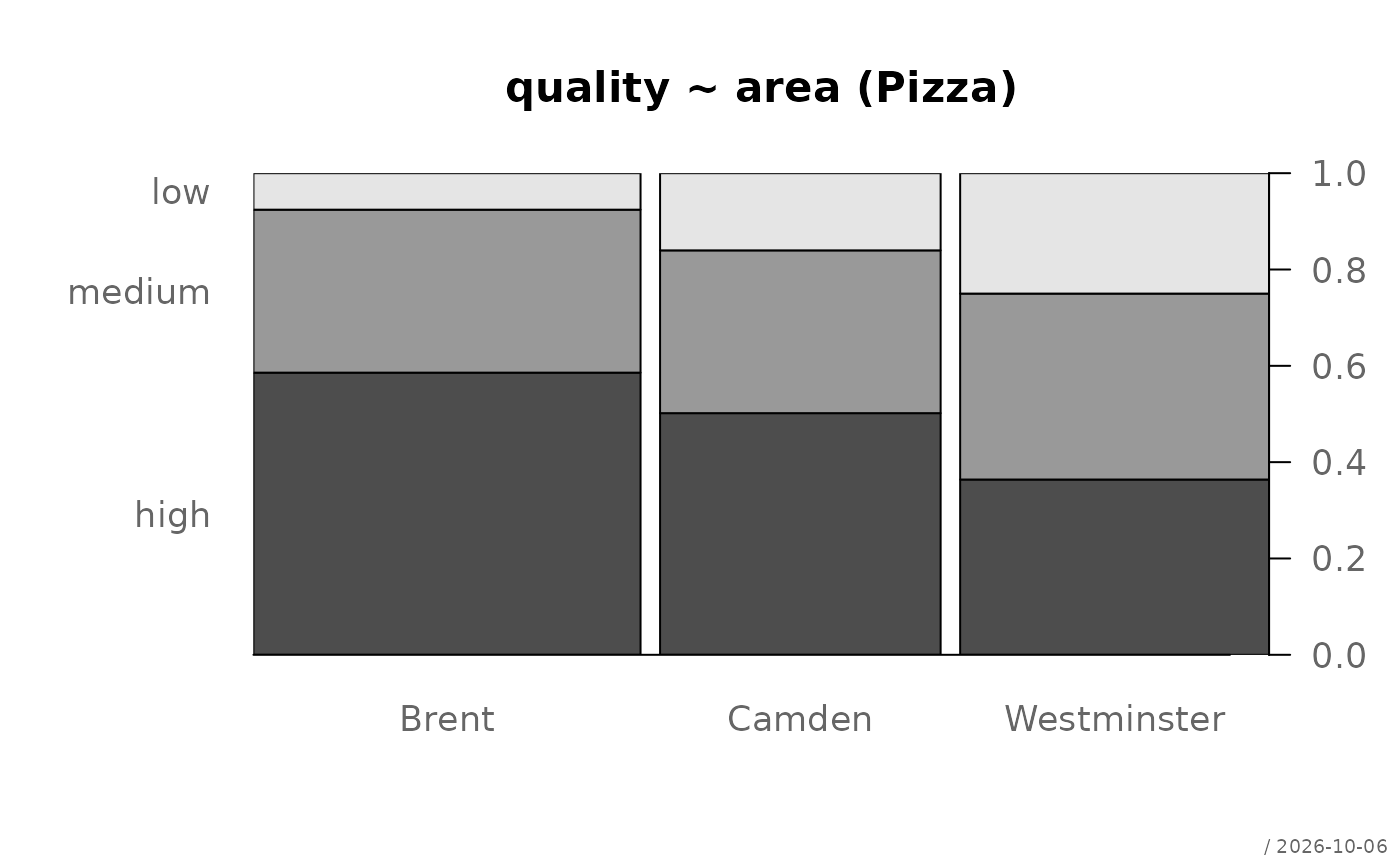
# the plots, see pharos::plot.Desc.table()
plot(d, which = 1)
# store result, print and plot separately
d <- desc(quality ~ area, Pizza, plotit = FALSE)
d
#> ──────────────────────────────────────────────────────────────────────────────
#> quality ~ area (Pizza) (Desc.qq)
#>
#> Summary:
#> pairs: 1209, valid: 999 (82.6%), missings: 210 (17.4%)
#>
#> Brent Camden Westminster Sum
#>
#> low freq 30 46 79 155
#> p.row 19.4% 29.7% 51.0% 15.5%
#>
#> medium freq 134 97 122 353
#> p.row 38.0% 27.5% 34.6% 35.3%
#>
#> high freq 232 144 115 491
#> p.row 47.3% 29.3% 23.4% 49.1%
#>
#> Sum freq 396 287 316 999
#> p.row 39.6% 28.7% 31.6% 100.0%
#>
#>
#> Pearson's Chi-squared test:
#> X-squared = 53.559, df = 4, p-value = 6.509e-11
#> Log likelihood ratio (G-test) test of independence:
#> G = 55.05, df = 4, p-value = 3.171e-11
#> Mantel-Haenszel Chi-squared:
#> X-squared = 51.341, df = 1, p-value = 7.762e-13
#>
#> Contingency Coeff. 0.226
#> Cramer V 0.164
#> Kendall Tau-b -0.196
#>
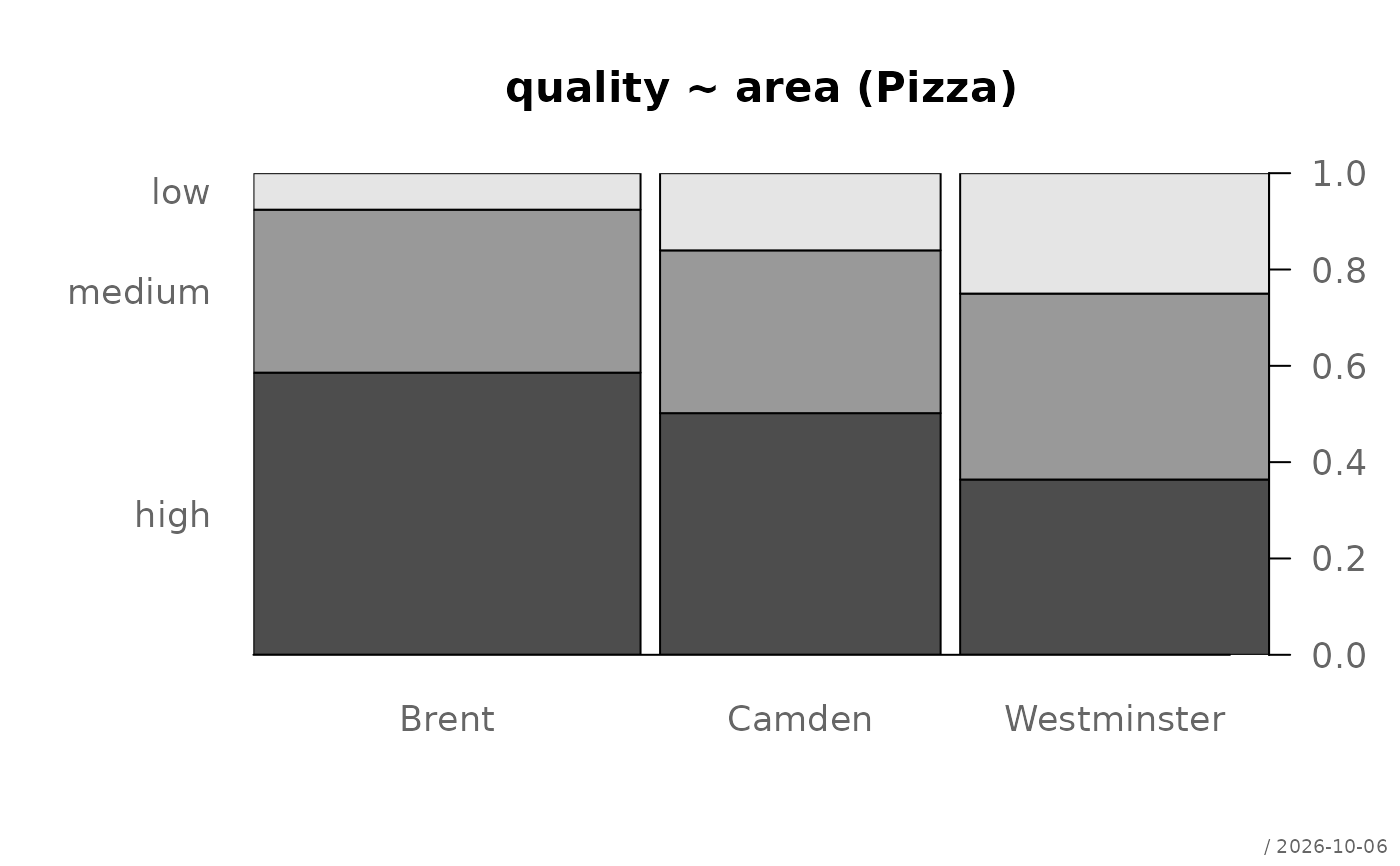
# the plots, see pharos::plot.Desc.table()
plot(d, which = 1)
 plot(d, which = 2)
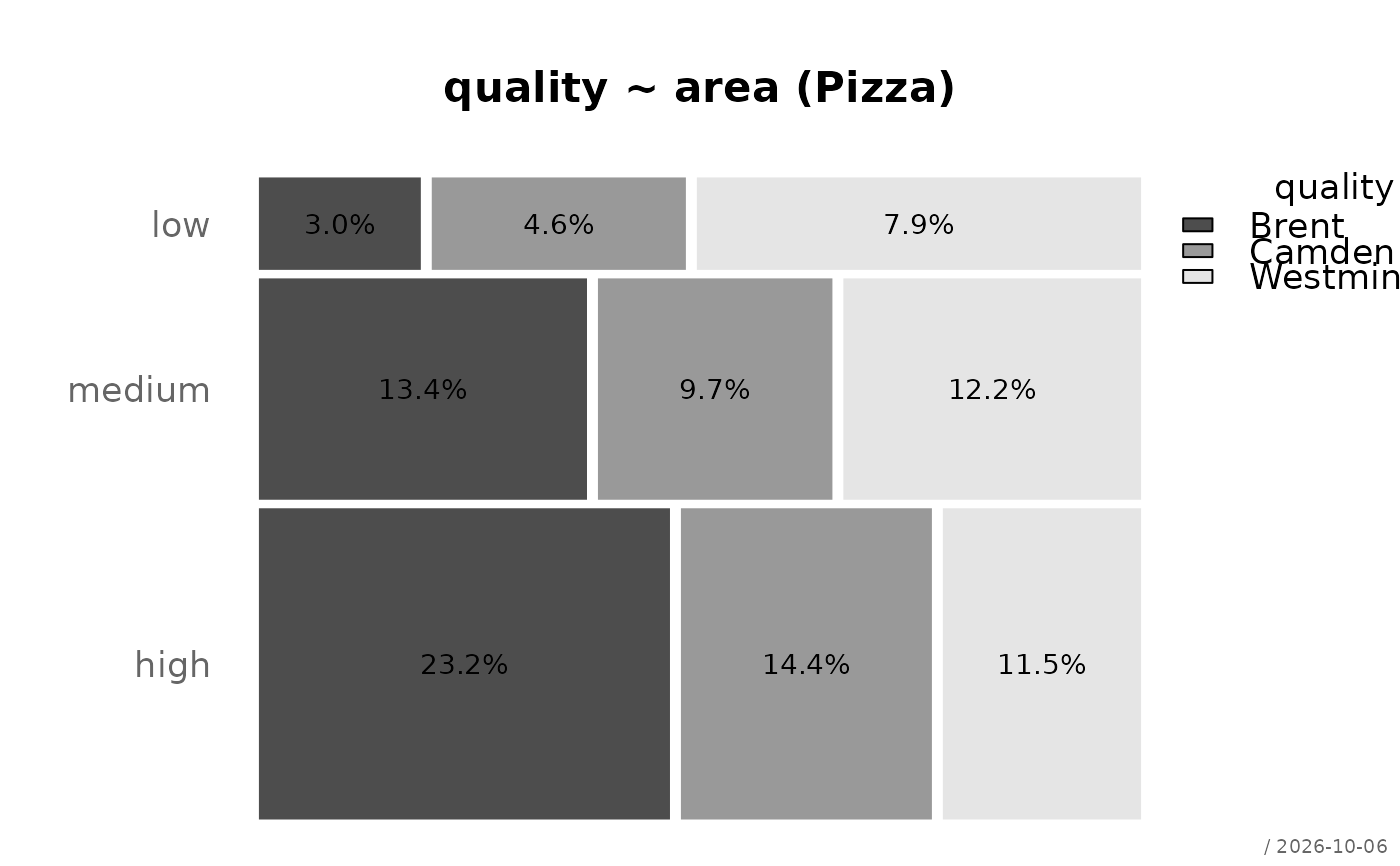 plot(d, which = 3)
 plot(d, which = 4) # association plot
 plot(d, which = 5) # heatmap
 # pipe
desc(quality ~ area, Pizza) |> plot(which = 4)
# pipe
desc(quality ~ area, Pizza) |> plot(which = 4)