Provides a compact diagnostic summary for univariate ts objects,
extending classical descriptive statistics with key time series diagnostics.
Arguments
- x
a univariate object of class
"ts"- maxLag
number of lags used in the Ljung-Box test; defaults to 12
- main
character string,
NULL, orNA, defining the main title. By default (main = NULL) the title will be composed as:(<class(es)>). If NA, no title is printed.- plotit
logical. Should a plot be created? The plot type depends on the classes of the variables. Default can be defined by the option
plotit, if it does not exist then it's set toFALSE.- verbose
integer controlling verbosity of table output. One of
1(minimal),2(default),3(extensive). Applies to tables only.- digits
number of digits used to format numeric values
- ...
further arguments passed to methods
Value
an object of class c("Desc.ts", "Desc") with, among others,
the components acf1, ljungbox, adf, kpss (test results),
stationary (logical, the combined rule above), trend (named vector
slope, p.value) and boxcoxlambda
Details
The function reports:
Lag-1 autocorrelation
Ljung-Box test for overall autocorrelation
Augmented Dickey-Fuller (ADF) test
KPSS test
Linear trend estimation (slope and p-value)
Suggested Box-Cox transformation parameter
The goal is to provide quick diagnostic guidance before model fitting (e.g., ARIMA specification).
Stationarity is evaluated using both the Augmented Dickey-Fuller (ADF) and KPSS tests. A combined decision rule is used: the series is considered stationary if the ADF test rejects the null hypothesis of a unit root (p < 0.05) and the KPSS test does not reject the null hypothesis of stationarity (p > 0.05).
The Box-Cox transformation parameter is estimated using
boxCoxLambda().
Missing values are allowed. The autocorrelation and the Ljung-Box test
keep the time structure (na.action = na.pass), the ADF and KPSS tests
and the Box-Cox parameter use the observed values only. The Box-Cox
parameter is NA unless all values are strictly positive.
References
Box, G. E. P., Jenkins, G. M., Reinsel, G. C., & Ljung, G. M. (2015). Time Series Analysis: Forecasting and Control.
Hyndman, R. J., & Athanasopoulos, G. (2021). Forecasting: Principles and Practice.
Examples
desc(AirPassengers)
#> ──────────────────────────────────────────────────────────────────────────────
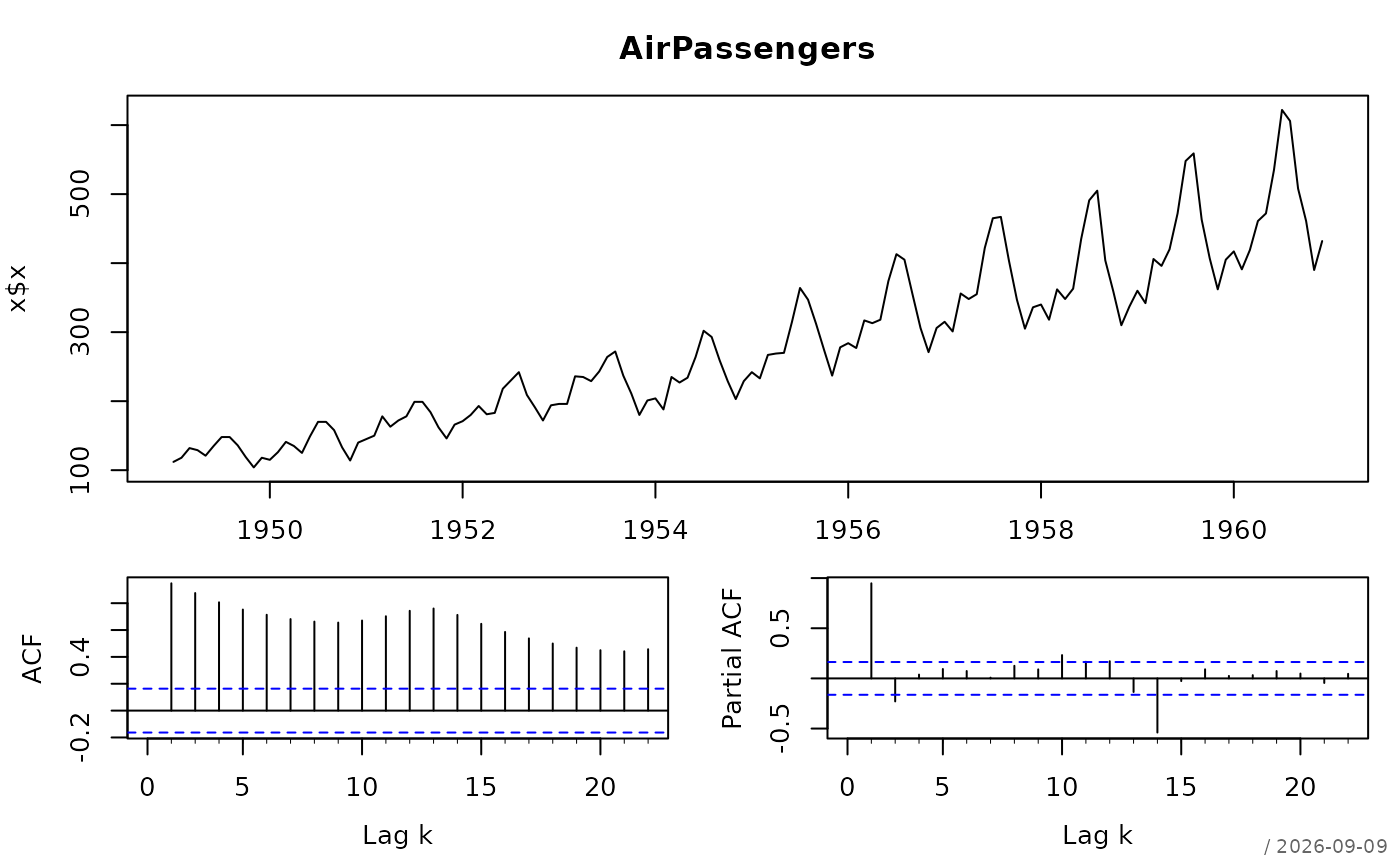
#> AirPassengers (ts)
#>
#> length n NAs unique 0s
#> 144 144 0 118 0
#> 100.0% 0.0% 0.0%
#>
#> start end frequency
#> 1949-1 1960-12 12
#>
#> lag-1 autocorrelation : 0.948
#> Ljung-Box (lag 12) : Q = 1036.482, p = < 0.001
#> ADF : -0.352, p = 0.502
#> KPSS : 2.739, p = <0.010
#> stationary : no
#> linear trend : slope = 31.886, p = < 0.001
#> Box-Cox lambda : 0.111
#>
 desc(Nile, maxLag = 10)
#> ──────────────────────────────────────────────────────────────────────────────
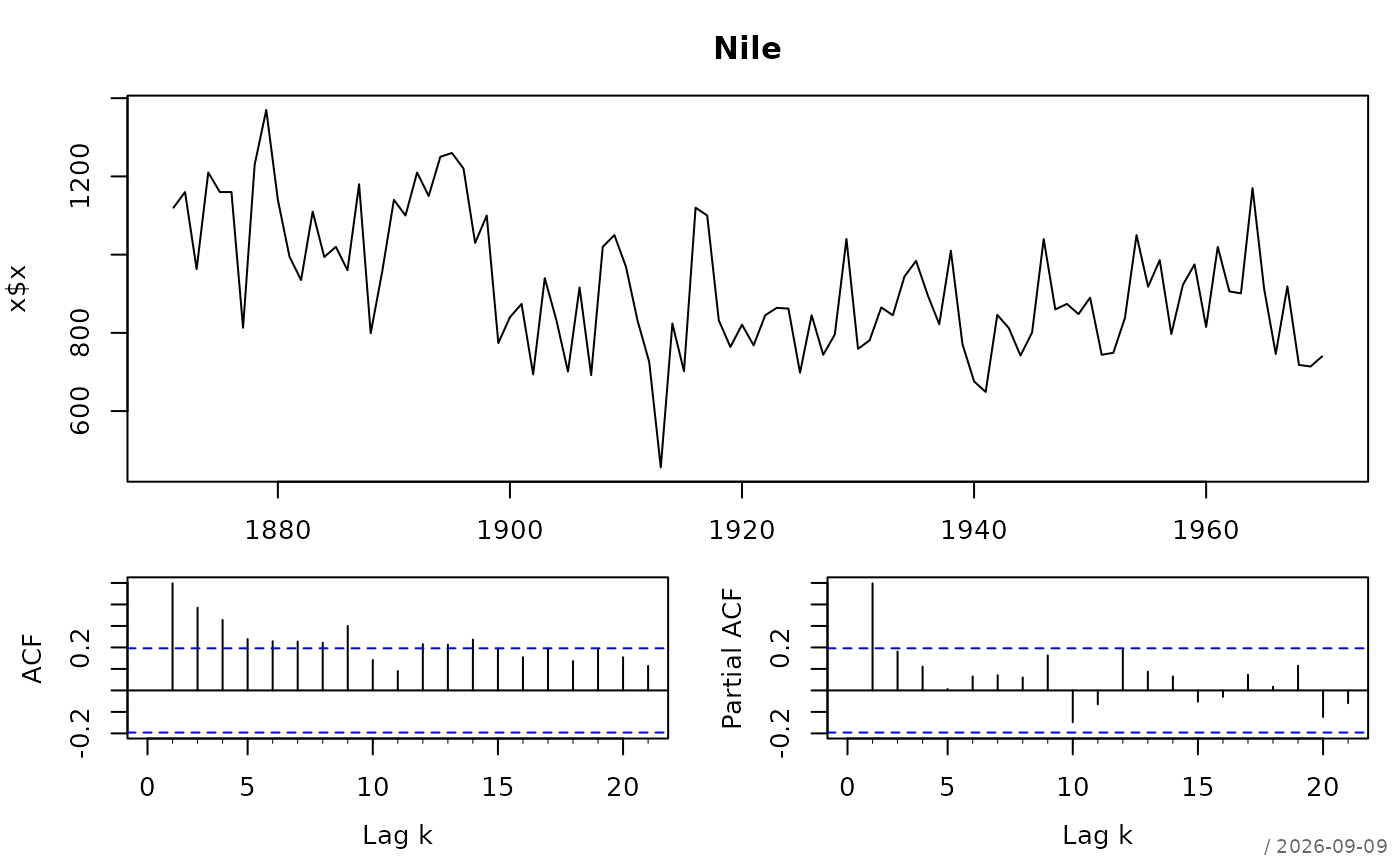
#> Nile (ts)
#>
#> length n NAs unique 0s
#> 100 100 0 85 0
#> 100.0% 0.0% 0.0%
#>
#> start end frequency
#> 1871-1 1970-1 1
#>
#> lag-1 autocorrelation : 0.498
#> Ljung-Box (lag 10) : Q = 88.127, p = < 0.001
#> ADF : -0.964, p = 0.306
#> KPSS : 0.965, p = <0.010
#> stationary : no
#> linear trend : slope = -2.714, p = < 0.001
#> Box-Cox lambda : 0.999
#>
desc(Nile, maxLag = 10)
#> ──────────────────────────────────────────────────────────────────────────────
#> Nile (ts)
#>
#> length n NAs unique 0s
#> 100 100 0 85 0
#> 100.0% 0.0% 0.0%
#>
#> start end frequency
#> 1871-1 1970-1 1
#>
#> lag-1 autocorrelation : 0.498
#> Ljung-Box (lag 10) : Q = 88.127, p = < 0.001
#> ADF : -0.964, p = 0.306
#> KPSS : 0.965, p = <0.010
#> stationary : no
#> linear trend : slope = -2.714, p = < 0.001
#> Box-Cox lambda : 0.999
#>