Computes descriptive statistics for the relationship between a categorical
variable y and a numeric variable x.
Usage
.descQN(y, x, conf.level = 0.95, breaks, right)

# S3 method for class 'Desc.qn'
print(x, verbose = NULL, ...)
Arguments
- x
a numeric variable
- verbose
amount of printed output
- ...
further arguments passed to methods
- y
a categorical variable (factor or coercible to factor)
- conf.level
confidence level for interval estimates (default 0.95)
- breaks
numeric vector defining cut points for
x. If not supplied, quartiles ofxare used.- right
logical; passed to
cut(), defining interval closure
Value
an object of class c("Desc.qn", "Desc") with components:
grpTablegroup-wise summary table
kwresult of the Kruskal-Wallis test
eta2effect size
leveneresult of Levene's test
tauBestimate, confidence interval, and p-value for Kendall's tau-b
spearmanestimate, confidence interval, and p-value for Spearman's correlation
aucarea under the curve for a binary outcome
prevTableprevalence table for a binary outcome with columns:
quantilequantile group
nnumber of complete cases in the group
estpoint estimate of the prevalence
lcilower confidence interval bound
uciupper confidence interval bound
caTestresult of the Cochran-Armitage test for a binary outcome
Details
The function summarizes how a numeric variable x differs across
levels of a categorical variable y.
Computed statistics
Group-wise descriptive statistics (median, IQR, counts)
Kruskal-Wallis test with effect size (\(\eta^2\))
Levene's test for homogeneity of variance
Kendall's Tau-b with confidence interval and p-value
Spearman correlation (reported for higher verbosity levels)
Binary outcomes
If y has two levels:
Area under the curve (AUC)
Prevalence across quantile groups of
xCochran-Armitage trend test
Quantile grouping
The numeric variable x is optionally discretized using
breaks. By default, quartiles are used.
Plots
The plot method pharos::plot.Desc.qn() is part of pharos; its help
page documents which and all further arguments. It draws one of the
following displays:
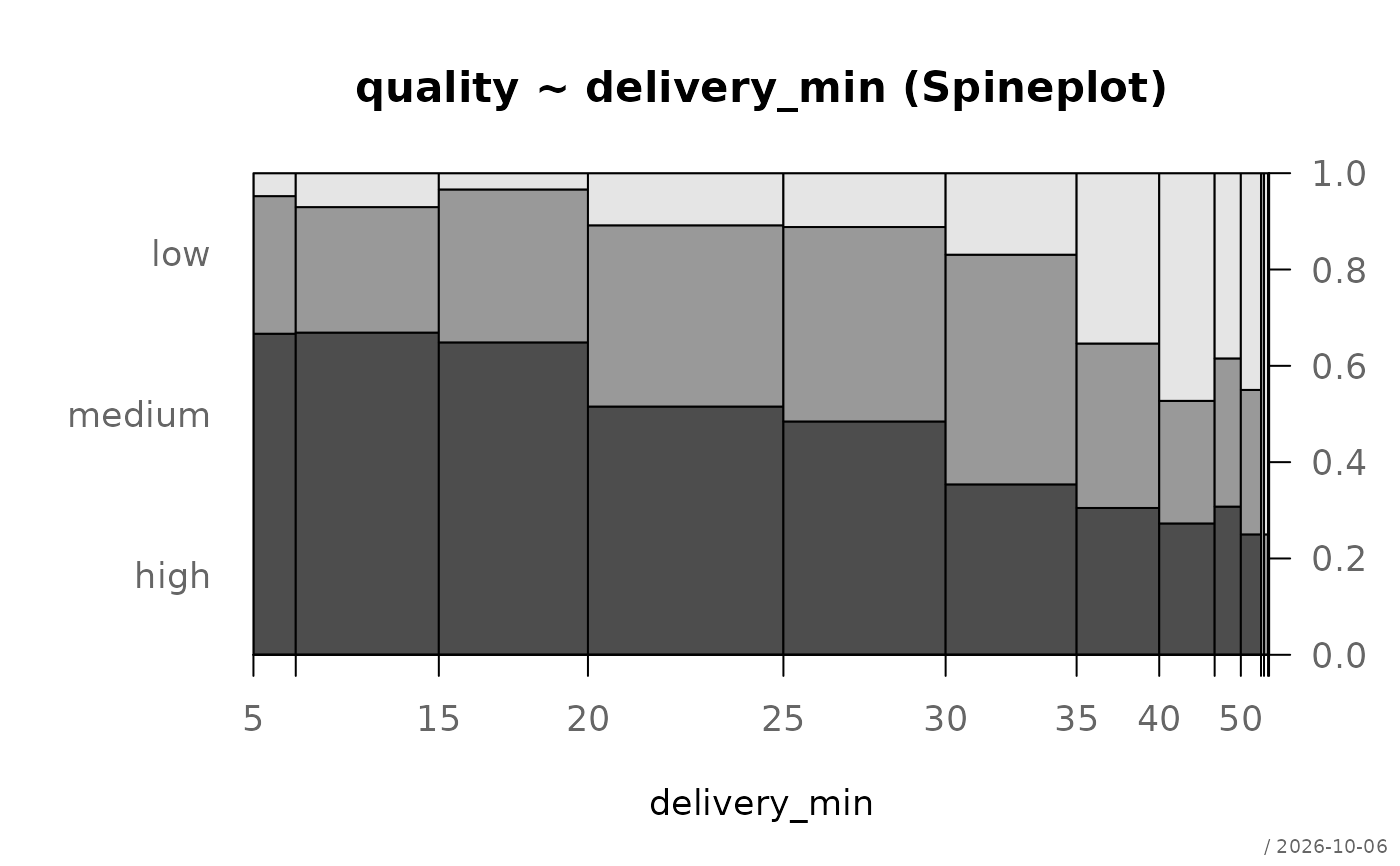
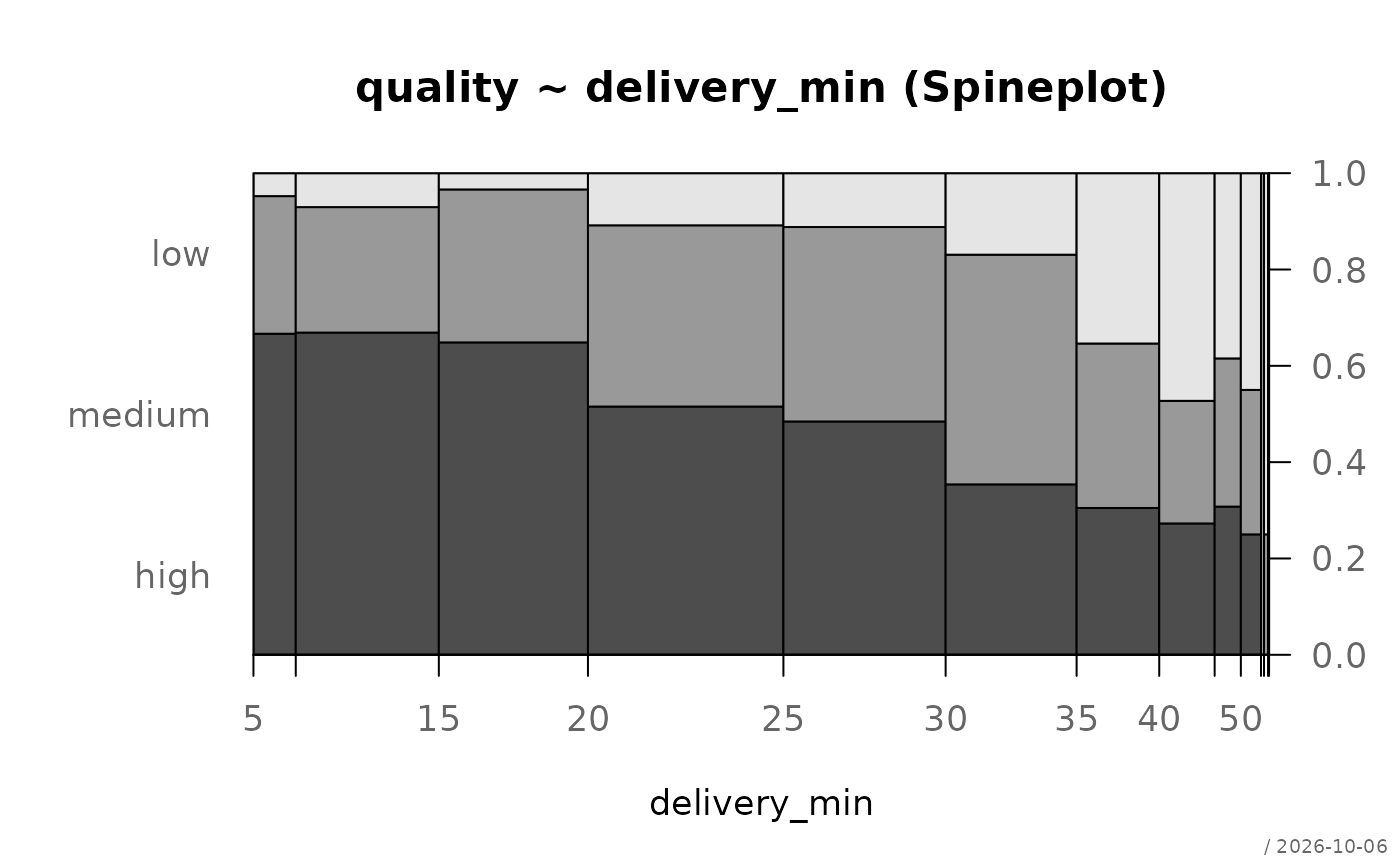
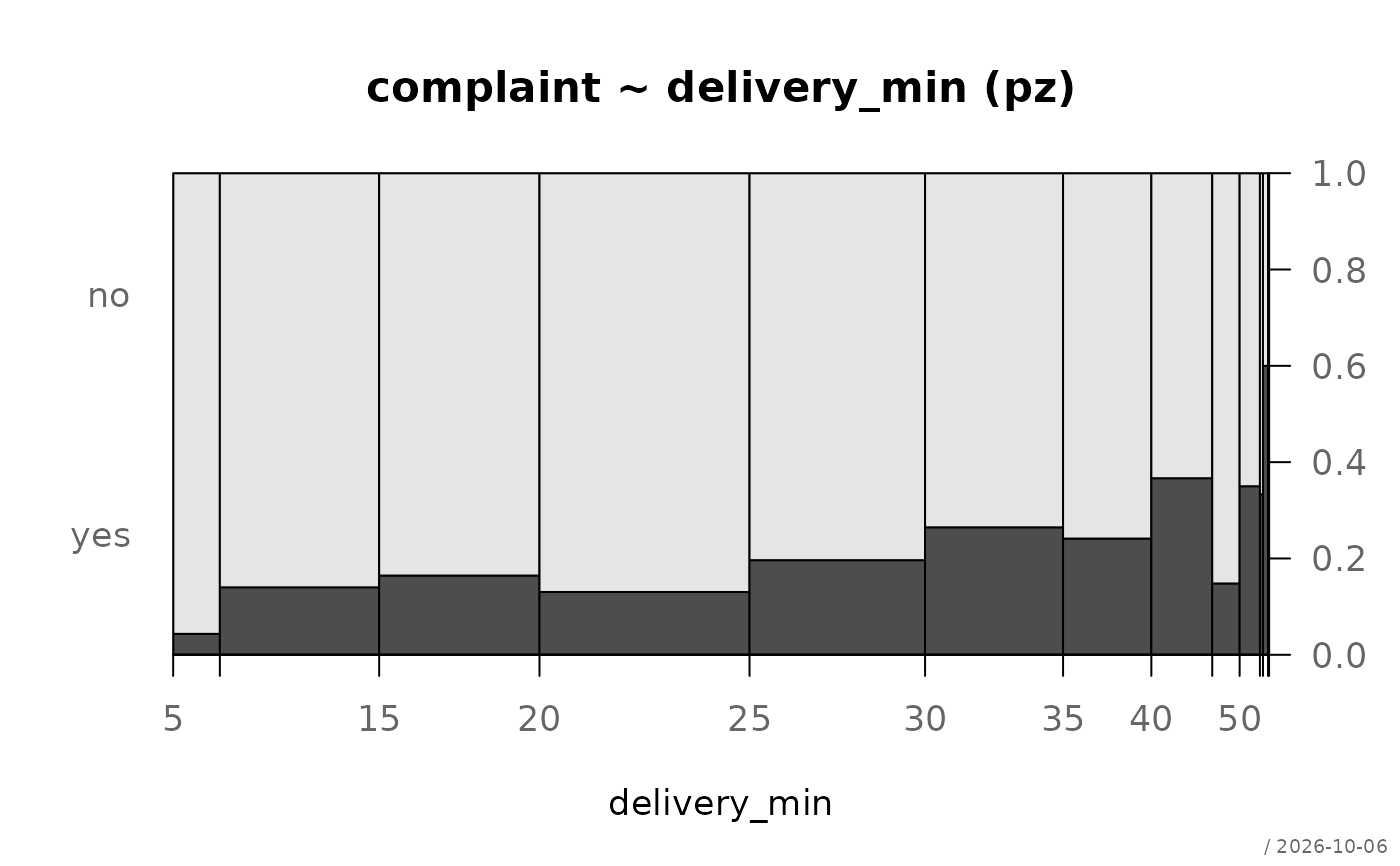
which = 1Spineplot of
yagainstx(default).which = 2Conditional density plot: the conditional distribution of
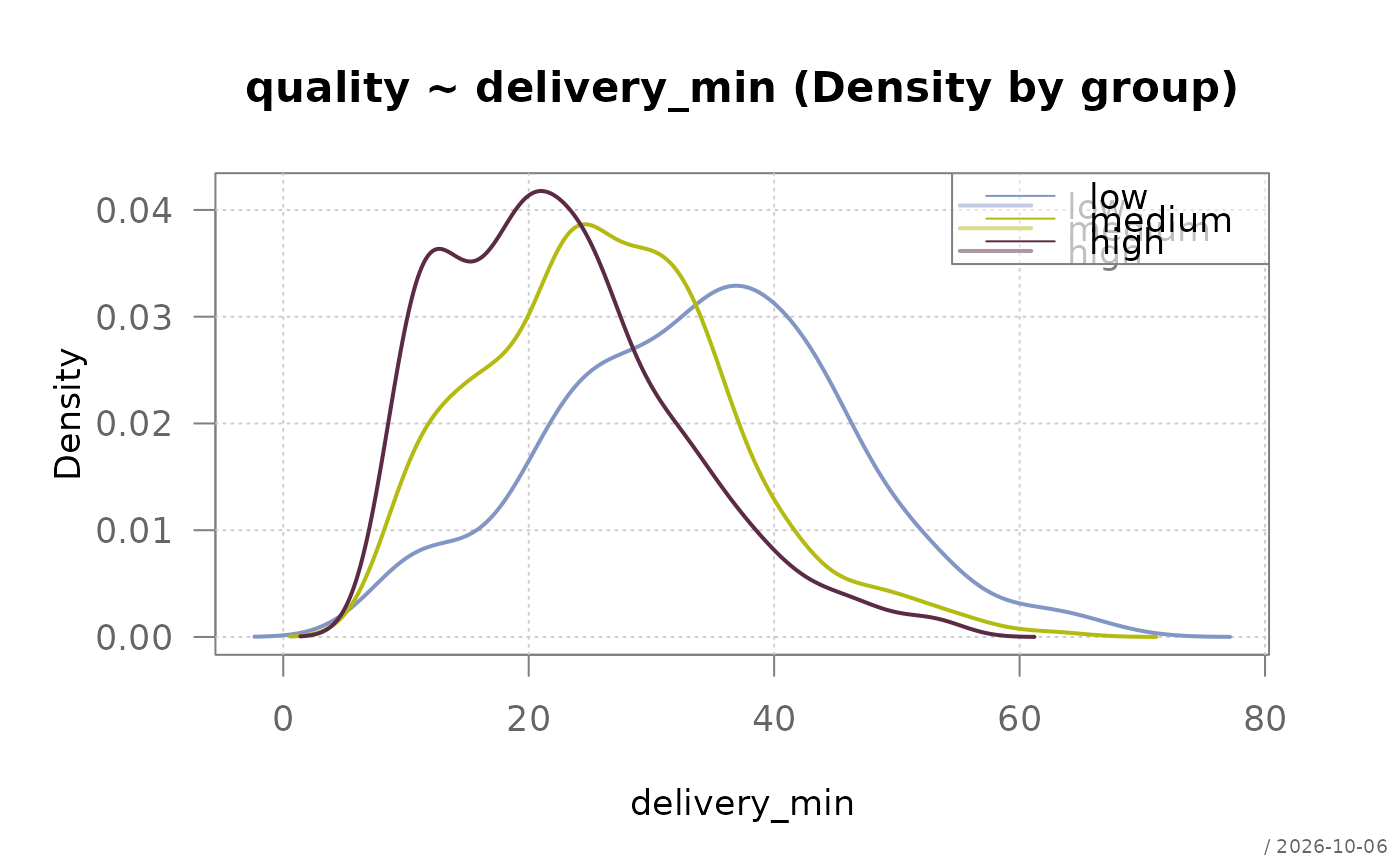
yalongx.which = 3Overlaid kernel density estimates of
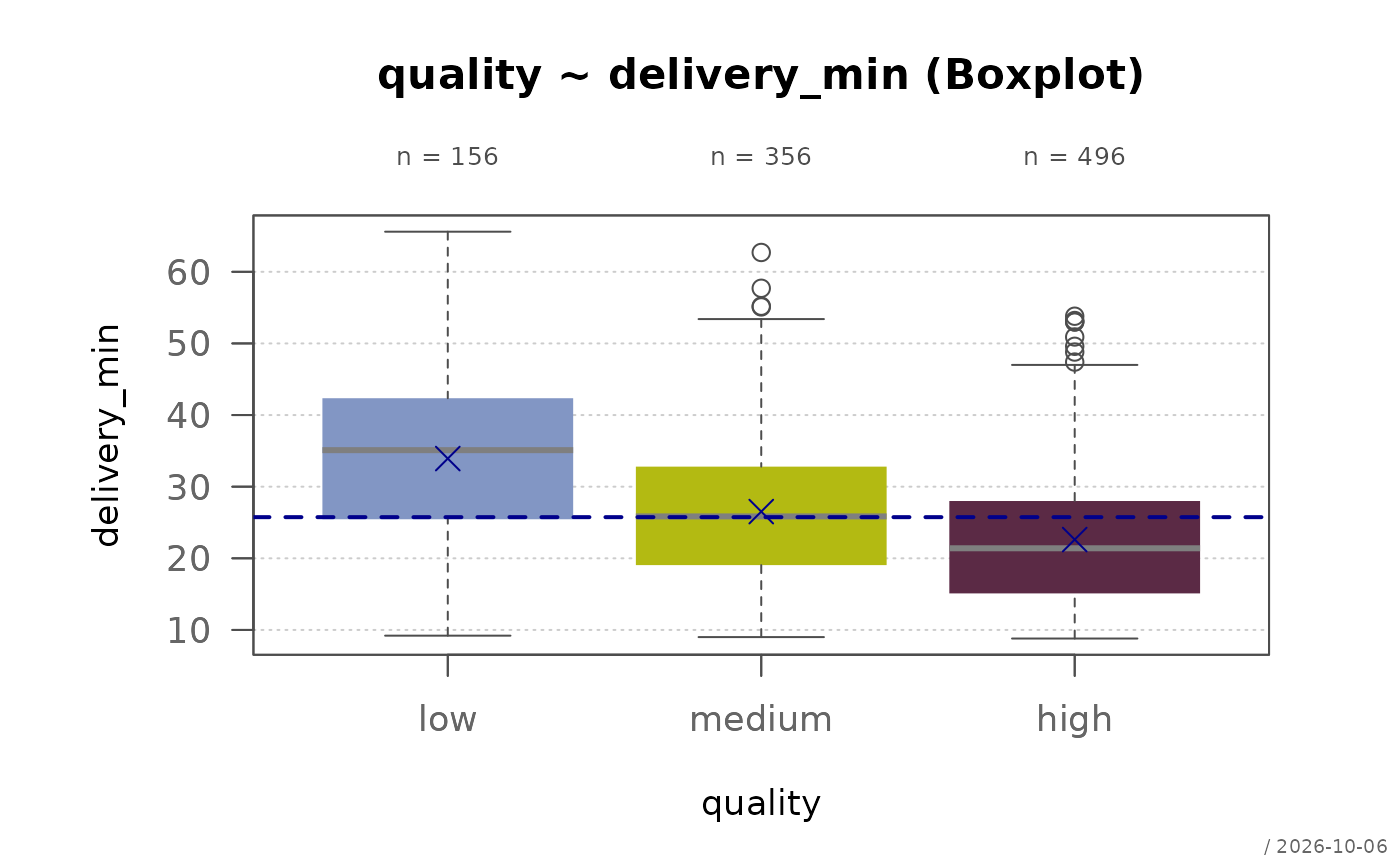
x, one per level ofy.which = 4Boxplots of
xby level ofy.which = 5Prevalence of the second level of
ywith Wilson confidence intervals across the groups ofx; binaryyonly.
See also
desc(), desc.nn(), desc.nq(), desc.qq(),
kruskal.test(), lumen::leveneTest()
Plot method: pharos::plot.Desc.qn()
Other desc:
desc(),
desc.Date(),
desc.factor(),
desc.nn,
desc.nq,
desc.numeric(),
desc.qq,
desc.table(),
desc.ts()
Examples
# basic usage via desc()
desc(quality ~ delivery_min, Pizza)
#> ──────────────────────────────────────────────────────────────────────────────
#> quality ~ delivery_min (Pizza) (Desc.qn)
#>
#> Summary:
#> pairs: 1209, valid: 1008 (83.4%), missings: 201 (16.6%), groups: 3
#>
#> low medium high
#> median 35.100 25.850 21.400
#> iqr 16.650 13.725 12.850
#> n 156 356 496
#> np 15.5% 35.3% 49.2%
#>
#> Kruskal-Wallis rank sum test:
#> H = 122, df = 2, p = <0.001
#> η² = 0.120 (moderate)
#>
#> Levene's test for homogeneity of variance (center = median):
#> F = 5.3528, df1 = 2, df2 = 1005, p = 0.00487
#>
#> Kendall Tau-b: -0.266 (-0.313, -0.220) *** small
#>
#> Conditional distribution of y by x-quantile:
#> xCut
#> yOk [9–17) [17–24) [24–33) [33–66)
#> low 5.3% 8.8% 13.4% 33.9%
#> medium 30.0% 33.1% 41.5% 36.6%
#> high 64.8% 58.2% 45.1% 29.6%
#>
 # more detail
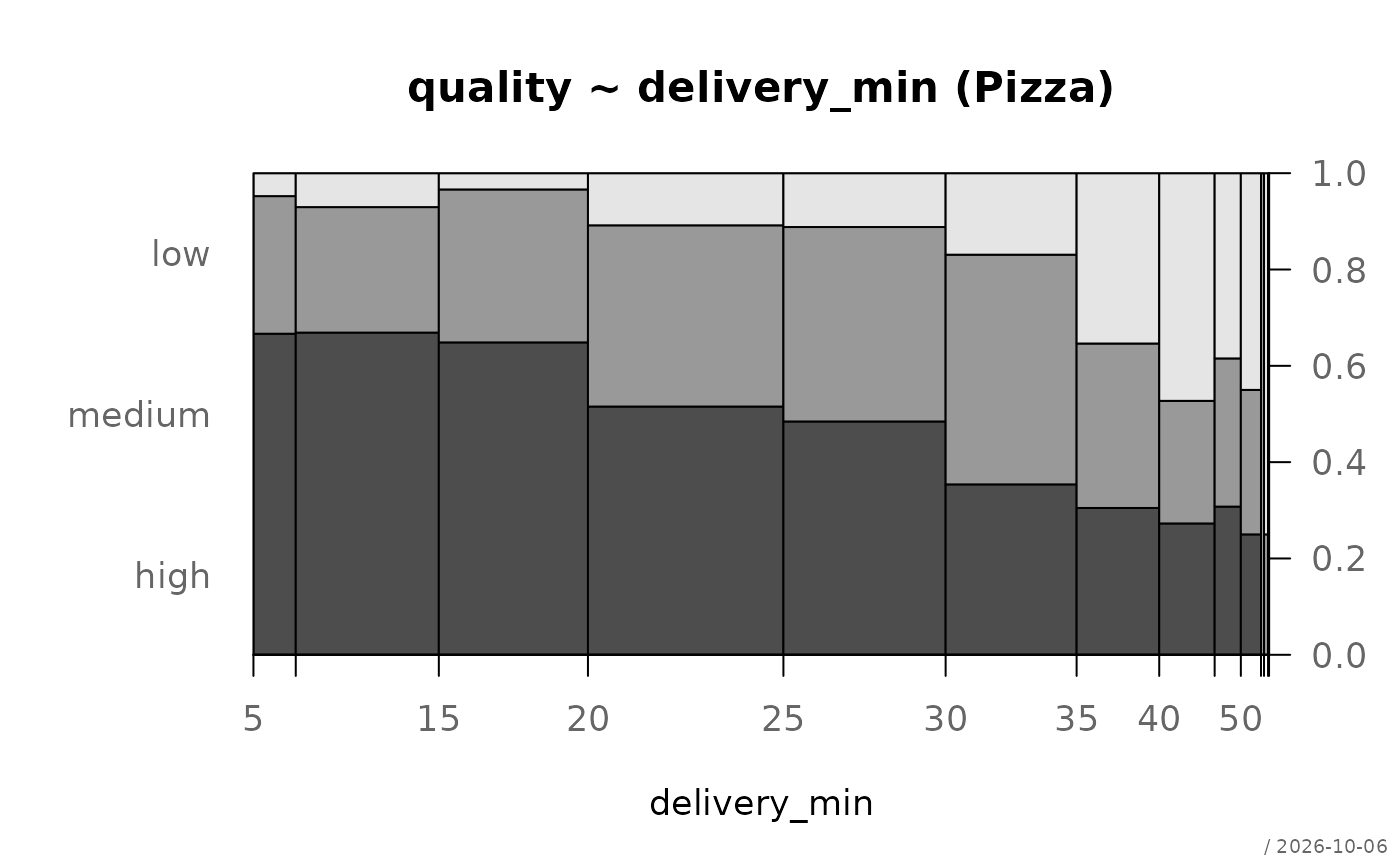
desc(quality ~ delivery_min, Pizza, verbose = 3)
#> ──────────────────────────────────────────────────────────────────────────────
#> quality ~ delivery_min (Pizza) (Desc.qn)
#>
#> Summary:
#> pairs: 1209, valid: 1008 (83.4%), missings: 201 (16.6%), groups: 3
#>
#> low medium high
#> mean 33.925 26.522 22.615
#> median 35.100 25.850 21.400
#> sd 11.742 10.113 9.497
#> iqr 16.650 13.725 12.850
#> n 156 356 496
#> np 15.5% 35.3% 49.2%
#> NAs 0 0 0
#> zeros 0 0 0
#>
#> Kruskal-Wallis rank sum test:
#> H = 122, df = 2, p = <0.001
#> η² = 0.120 (moderate)
#>
#> Levene's test for homogeneity of variance (center = median):
#> F = 5.3528, df1 = 2, df2 = 1005, p = 0.00487
#>
#> Kendall Tau-b: -0.266 (-0.313, -0.220) *** small
#> Spearman r: -0.335 (-0.389, -0.279) *** moderate
#>
#> Conditional distribution of y by x-quantile:
#> xCut
#> yOk [9–17) [17–24) [24–33) [33–66)
#> low 5.3% 8.8% 13.4% 33.9%
#> medium 30.0% 33.1% 41.5% 36.6%
#> high 64.8% 58.2% 45.1% 29.6%
#>
# more detail
desc(quality ~ delivery_min, Pizza, verbose = 3)
#> ──────────────────────────────────────────────────────────────────────────────
#> quality ~ delivery_min (Pizza) (Desc.qn)
#>
#> Summary:
#> pairs: 1209, valid: 1008 (83.4%), missings: 201 (16.6%), groups: 3
#>
#> low medium high
#> mean 33.925 26.522 22.615
#> median 35.100 25.850 21.400
#> sd 11.742 10.113 9.497
#> iqr 16.650 13.725 12.850
#> n 156 356 496
#> np 15.5% 35.3% 49.2%
#> NAs 0 0 0
#> zeros 0 0 0
#>
#> Kruskal-Wallis rank sum test:
#> H = 122, df = 2, p = <0.001
#> η² = 0.120 (moderate)
#>
#> Levene's test for homogeneity of variance (center = median):
#> F = 5.3528, df1 = 2, df2 = 1005, p = 0.00487
#>
#> Kendall Tau-b: -0.266 (-0.313, -0.220) *** small
#> Spearman r: -0.335 (-0.389, -0.279) *** moderate
#>
#> Conditional distribution of y by x-quantile:
#> xCut
#> yOk [9–17) [17–24) [24–33) [33–66)
#> low 5.3% 8.8% 13.4% 33.9%
#> medium 30.0% 33.1% 41.5% 36.6%
#> high 64.8% 58.2% 45.1% 29.6%
#>
 # store result, print and plot separately
d <- desc(quality ~ delivery_min, Pizza, plotit = FALSE)
print(d, verbose = 1)
#> ──────────────────────────────────────────────────────────────────────────────
#> quality ~ delivery_min (Pizza) (Desc.qn)
#>
#> Summary:
#> pairs: 1209, valid: 1008 (83.4%), missings: 201 (16.6%), groups: 3
#>
#> low medium high
#> median 35.100 25.850 21.400
#> n 156 356 496
#> np 15.5% 35.3% 49.2%
#>
#> Kruskal-Wallis rank sum test:
#> H = 122, df = 2, p = <0.001
#> η² = 0.120 (moderate)
#>
#> Conditional distribution of y by x-quantile:
#> xCut
#> yOk [9–17) [17–24) [24–33) [33–66)
#> low 5.3% 8.8% 13.4% 33.9%
#> medium 30.0% 33.1% 41.5% 36.6%
#> high 64.8% 58.2% 45.1% 29.6%
#>
# the plots, see pharos::plot.Desc.qn()
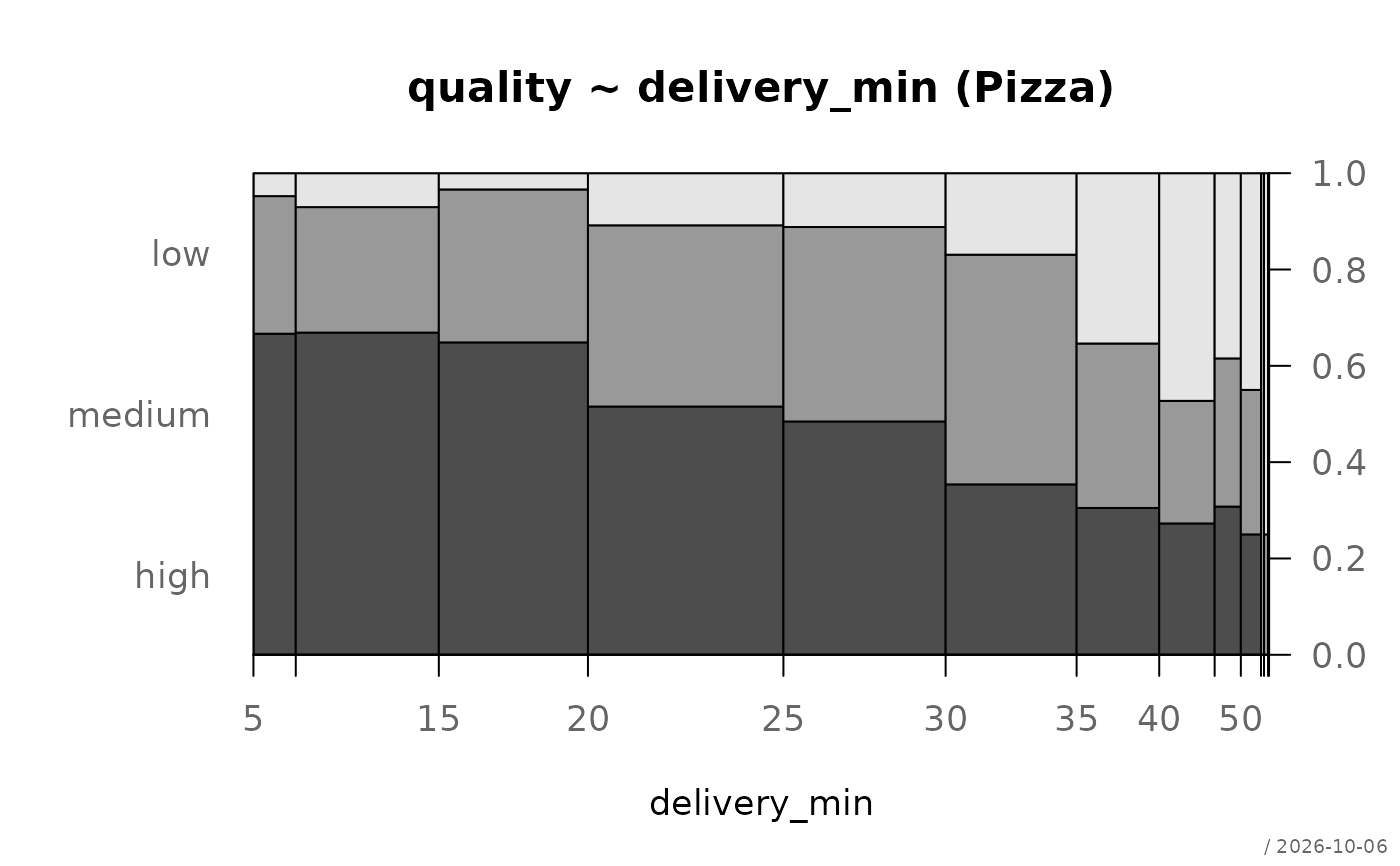
plot(d, which = 1) # spineplot
# store result, print and plot separately
d <- desc(quality ~ delivery_min, Pizza, plotit = FALSE)
print(d, verbose = 1)
#> ──────────────────────────────────────────────────────────────────────────────
#> quality ~ delivery_min (Pizza) (Desc.qn)
#>
#> Summary:
#> pairs: 1209, valid: 1008 (83.4%), missings: 201 (16.6%), groups: 3
#>
#> low medium high
#> median 35.100 25.850 21.400
#> n 156 356 496
#> np 15.5% 35.3% 49.2%
#>
#> Kruskal-Wallis rank sum test:
#> H = 122, df = 2, p = <0.001
#> η² = 0.120 (moderate)
#>
#> Conditional distribution of y by x-quantile:
#> xCut
#> yOk [9–17) [17–24) [24–33) [33–66)
#> low 5.3% 8.8% 13.4% 33.9%
#> medium 30.0% 33.1% 41.5% 36.6%
#> high 64.8% 58.2% 45.1% 29.6%
#>
# the plots, see pharos::plot.Desc.qn()
plot(d, which = 1) # spineplot
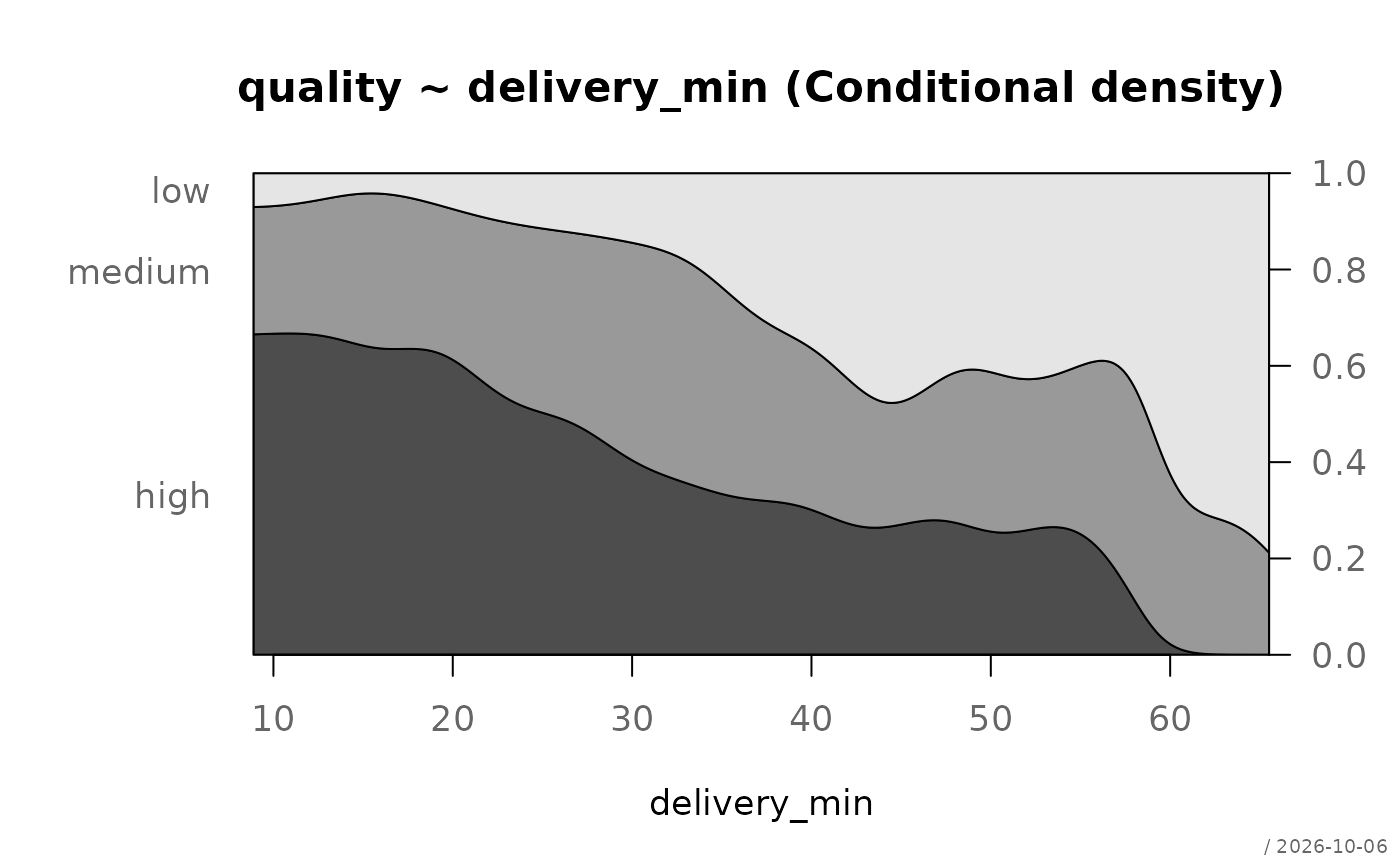 plot(d, which = 2) # conditional density
 plot(d, which = 3) # densities by level of y
 plot(d, which = 4) # boxplots
 # binary y: AUC, prevalence by groups of x, Cochran-Armitage test
# (complaint is stored as 0/1 and would be described as numeric-numeric)
pz <- transform(Pizza, complaint = factor(complaint, levels = 0:1,
labels = c("no", "yes")))
d2 <- desc(complaint ~ delivery_min, pz, plotit = FALSE)
d2
#> ──────────────────────────────────────────────────────────────────────────────
#> complaint ~ delivery_min (pz) (Desc.qn)
#>
#> Summary:
#> pairs: 1209, valid: 1080 (89.3%), missings: 129 (10.7%), groups: 2
#>
#> no yes
#> median 23.700 29.000
#> iqr 14.750 16.200
#> n 875 205
#> np 81.0% 19.0%
#>
#> Kruskal-Wallis rank sum test:
#> H = 25, df = 1, p = <0.001
#> η² = 0.022 (small)
#>
#> Levene's test for homogeneity of variance (center = median):
#> F = 3.5339, df1 = 1, df2 = 1078, p = 0.0604
#>
#> AUC = 61.2% (no vs yes)
#>
#> Kendall Tau-b: 0.124 ( 0.076, 0.173) *** small
#>
#> Prevalence of "yes" by groups (Wilson CI):
#> n est lci uci
#> ----------------------------------------------------
#> [9–17) 271 13.3% 9.8% 17.8%
#> [17–24) 267 13.9% 10.2% 18.5%
#> [24–33) 271 19.6% 15.3% 24.7%
#> [33–66) 271 29.2% 24.1% 34.8%
#>
#> Cochran-Armitage trend test:
#> Z = -4.998, p = <0.001
#>
plot(d2, which = 5) # prevalence with Wilson CI
# binary y: AUC, prevalence by groups of x, Cochran-Armitage test
# (complaint is stored as 0/1 and would be described as numeric-numeric)
pz <- transform(Pizza, complaint = factor(complaint, levels = 0:1,
labels = c("no", "yes")))
d2 <- desc(complaint ~ delivery_min, pz, plotit = FALSE)
d2
#> ──────────────────────────────────────────────────────────────────────────────
#> complaint ~ delivery_min (pz) (Desc.qn)
#>
#> Summary:
#> pairs: 1209, valid: 1080 (89.3%), missings: 129 (10.7%), groups: 2
#>
#> no yes
#> median 23.700 29.000
#> iqr 14.750 16.200
#> n 875 205
#> np 81.0% 19.0%
#>
#> Kruskal-Wallis rank sum test:
#> H = 25, df = 1, p = <0.001
#> η² = 0.022 (small)
#>
#> Levene's test for homogeneity of variance (center = median):
#> F = 3.5339, df1 = 1, df2 = 1078, p = 0.0604
#>
#> AUC = 61.2% (no vs yes)
#>
#> Kendall Tau-b: 0.124 ( 0.076, 0.173) *** small
#>
#> Prevalence of "yes" by groups (Wilson CI):
#> n est lci uci
#> ----------------------------------------------------
#> [9–17) 271 13.3% 9.8% 17.8%
#> [17–24) 267 13.9% 10.2% 18.5%
#> [24–33) 271 19.6% 15.3% 24.7%
#> [33–66) 271 29.2% 24.1% 34.8%
#>
#> Cochran-Armitage trend test:
#> Z = -4.998, p = <0.001
#>
plot(d2, which = 5) # prevalence with Wilson CI
 # own breaks instead of quartiles
desc(complaint ~ delivery_min, pz, breaks = c(20, 30, 40))
#> ──────────────────────────────────────────────────────────────────────────────
#> complaint ~ delivery_min (pz) (Desc.qn)
#>
#> Summary:
#> pairs: 1209, valid: 1080 (89.3%), missings: 129 (10.7%), groups: 2
#>
#> no yes
#> median 23.700 29.000
#> iqr 14.750 16.200
#> n 875 205
#> np 81.0% 19.0%
#>
#> Kruskal-Wallis rank sum test:
#> H = 25, df = 1, p = <0.001
#> η² = 0.022 (small)
#>
#> Levene's test for homogeneity of variance (center = median):
#> F = 3.5339, df1 = 1, df2 = 1078, p = 0.0604
#>
#> AUC = 61.2% (no vs yes)
#>
#> Kendall Tau-b: 0.124 ( 0.076, 0.173) *** small
#>
#> Prevalence of "yes" by groups (Wilson CI):
#> n est lci uci
#> ----------------------------------------------------
#> [9–20) 358 14.0% 10.8% 17.9%
#> [20–30) 378 16.1% 12.8% 20.2%
#> [30–40) 225 24.4% 19.3% 30.5%
#> [40–66) 119 32.8% 25.0% 41.6%
#>
#> Cochran-Armitage trend test:
#> Z = -4.966, p = <0.001
#>
# own breaks instead of quartiles
desc(complaint ~ delivery_min, pz, breaks = c(20, 30, 40))
#> ──────────────────────────────────────────────────────────────────────────────
#> complaint ~ delivery_min (pz) (Desc.qn)
#>
#> Summary:
#> pairs: 1209, valid: 1080 (89.3%), missings: 129 (10.7%), groups: 2
#>
#> no yes
#> median 23.700 29.000
#> iqr 14.750 16.200
#> n 875 205
#> np 81.0% 19.0%
#>
#> Kruskal-Wallis rank sum test:
#> H = 25, df = 1, p = <0.001
#> η² = 0.022 (small)
#>
#> Levene's test for homogeneity of variance (center = median):
#> F = 3.5339, df1 = 1, df2 = 1078, p = 0.0604
#>
#> AUC = 61.2% (no vs yes)
#>
#> Kendall Tau-b: 0.124 ( 0.076, 0.173) *** small
#>
#> Prevalence of "yes" by groups (Wilson CI):
#> n est lci uci
#> ----------------------------------------------------
#> [9–20) 358 14.0% 10.8% 17.9%
#> [20–30) 378 16.1% 12.8% 20.2%
#> [30–40) 225 24.4% 19.3% 30.5%
#> [40–66) 119 32.8% 25.0% 41.6%
#>
#> Cochran-Armitage trend test:
#> Z = -4.966, p = <0.001
#>
 # pipe
desc(quality ~ delivery_min, Pizza) |> plot(which = 2)
# pipe
desc(quality ~ delivery_min, Pizza) |> plot(which = 2)