Computes, prints and plots descriptive statistics for a numeric variable
x grouped by a categorical variable g. The function is dispatched
automatically by desc(y ~ g, data) when y is numeric and g
categorical.
Arguments
- x
a numeric variable for
.descNQ(), or an object of class"Desc.nq"for the print and plot methods- digits
currently unused
- ...
further arguments. In
.descNQ()unused, inprint()passed tobedrock::printCharMatrix(). Inplot()they are passed on to the plot function selected bywhich(see section Plots, where each function is linked) and go unchanged to every selected plot.- main
main title for the plot; defaults to the title stored in
x$meta$main- which
integer vector selecting the plots to draw, one plot per element, see section Plots. Default
1.- g
a categorical grouping variable (factor or coercible to factor)
Value
.descNQ() returns an object of class c("Desc.nq", "Desc")
with components:
tabgroup-wise summary table
testresult of the Kruskal-Wallis test
vtestresult of Levene's test
etaeffect size
The plot method returns x invisibly.
Details
The function summarizes the distribution of x across levels of
g and performs nonparametric tests of group differences.
Computed statistics
Group-wise descriptive statistics (mean, median, SD, IQR, counts)
Kruskal-Wallis test
Effect size (\(\eta^2\)) based on the Kruskal-Wallis statistic
Levene's test for homogeneity of variance
Interpretation
The Kruskal-Wallis test evaluates whether the distribution of x
differs between groups defined by g. The effect size \(\eta^2\)
provides a standardized measure of group differences.
Plots
plot() draws one of three displays of x by group, selected by
which. All arguments in ... go straight to the underlying
function; its help page lists what can be set.
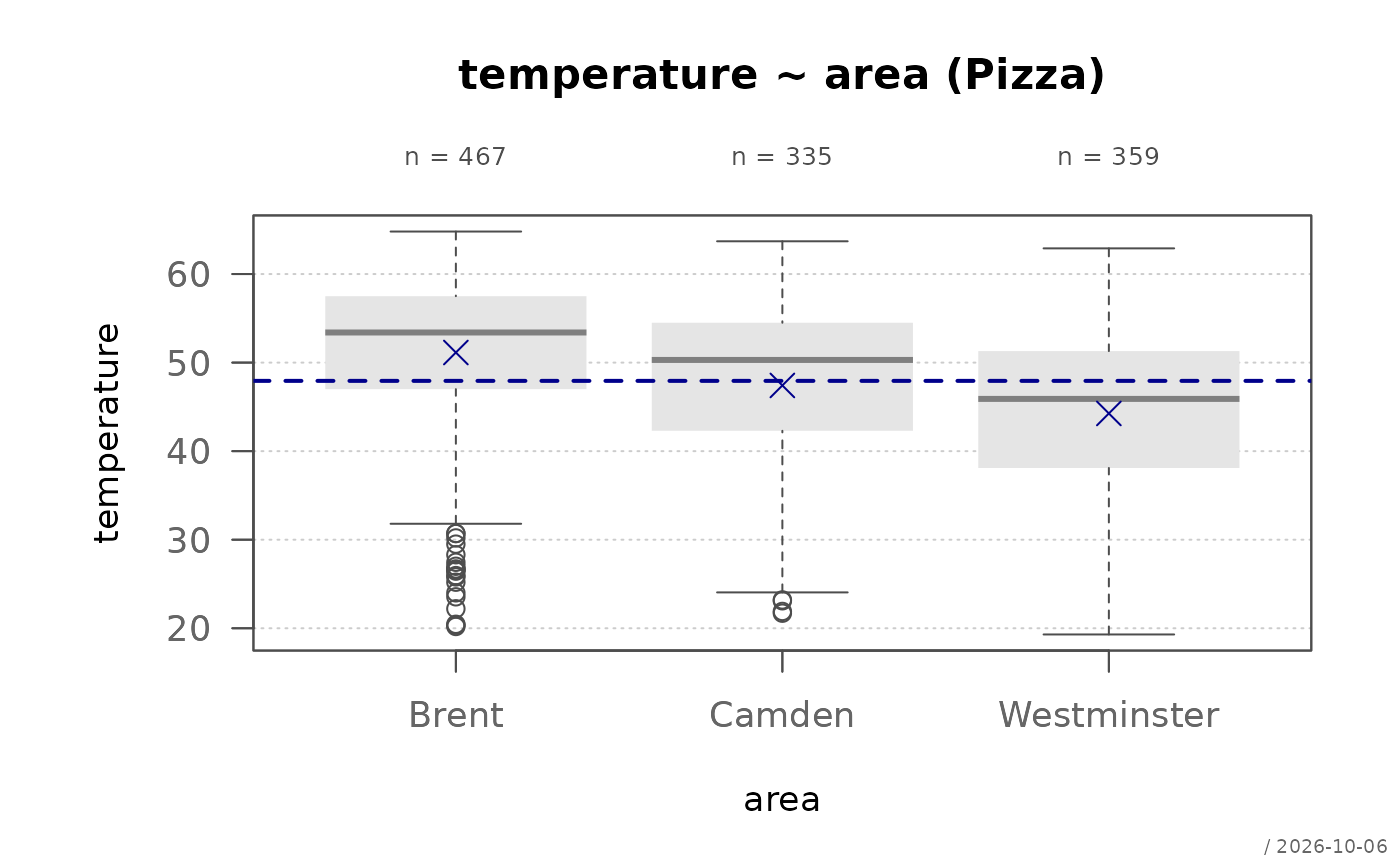
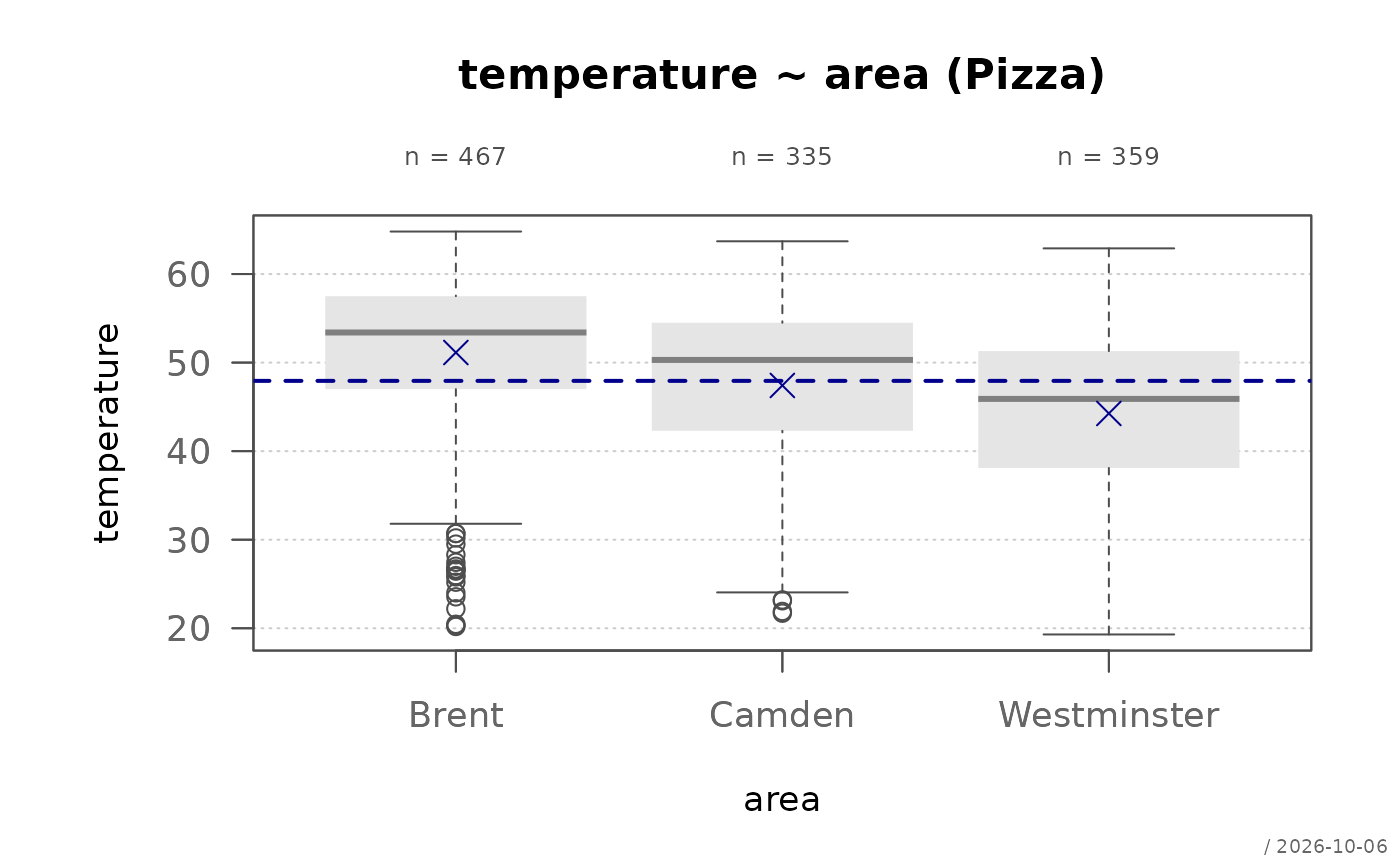
which = 1Boxplots by group, drawn by
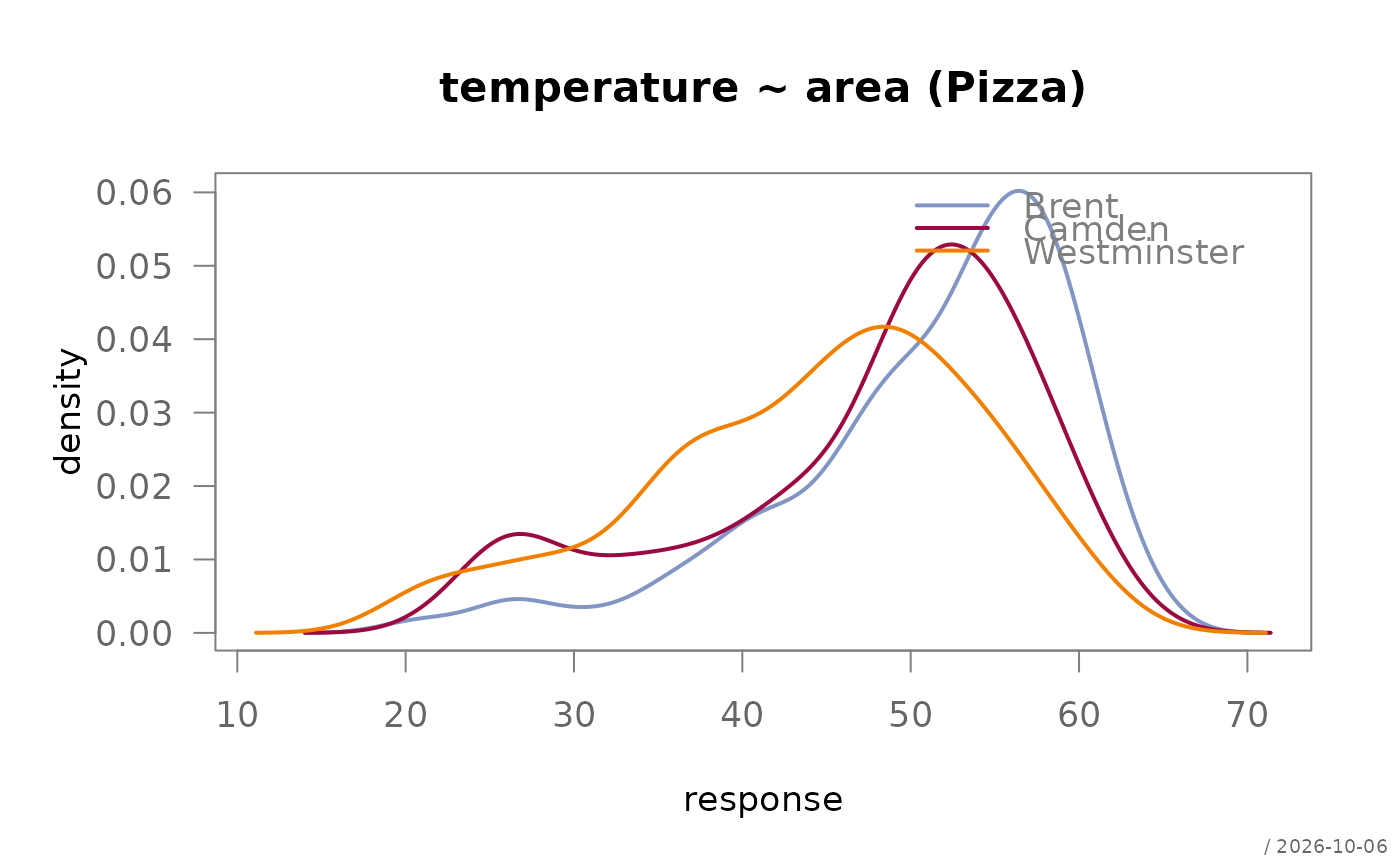
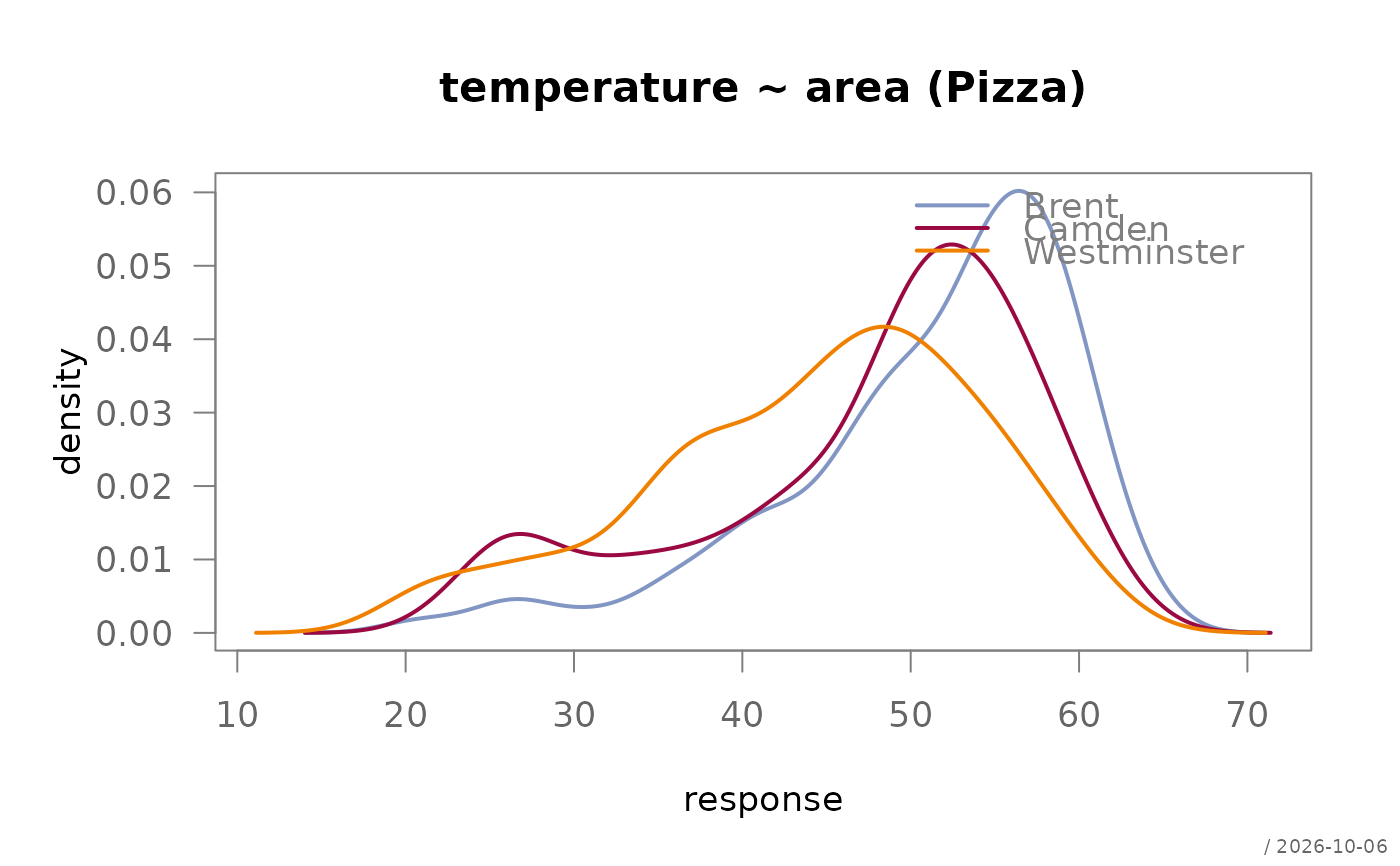
pharos::plotBox(). Axes are labelled with the variable names.which = 2Overlaid kernel density estimates, one per group, drawn by
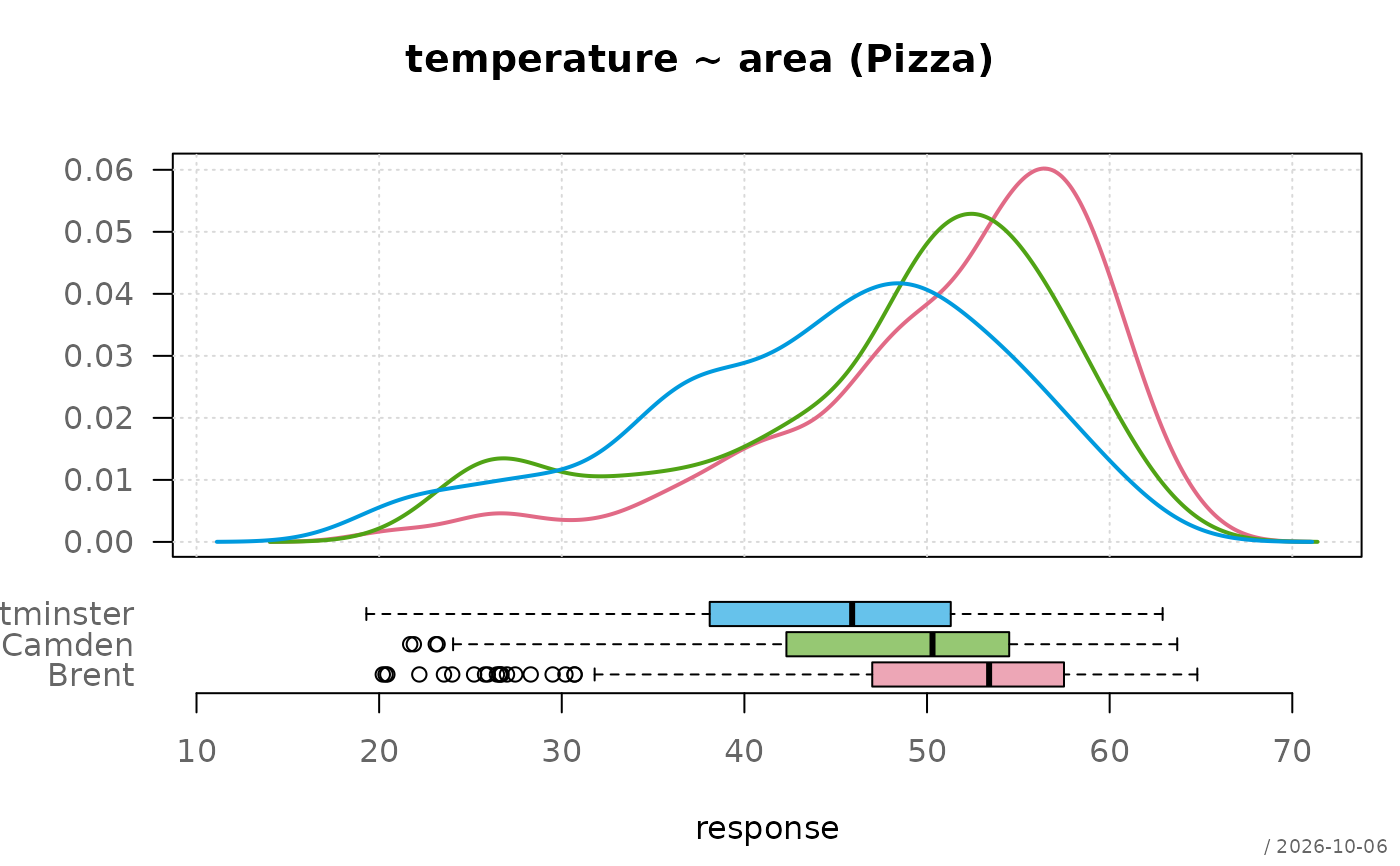
pharos::plotDens().which = 3Density and boxplot combined per group, drawn by
pharos::plotDensBox().
main defaults to the title stored in the object and is passed to
every plot.
See also
desc(), desc.qn(), desc.nn(), desc.qq(),
kruskal.test(), lumen::leveneTest()
Plot functions: pharos::plotBox(), pharos::plotDens(),
pharos::plotDensBox()
Other desc:
desc(),
desc.Date(),
desc.factor(),
desc.nn,
desc.numeric(),
desc.qn,
desc.qq,
desc.table(),
desc.ts()
Examples
# basic usage via desc()
desc(temperature ~ area, Pizza)
#> ──────────────────────────────────────────────────────────────────────────────
#> temperature ~ area (Pizza) (Desc.nq)
#>
#> Summary:
#> pairs: 1209, valid: 1161 (96.0%), missings: 48 (4.0%), groups: 3
#>
#> Brent Camden Westminster
#> mean 51.139 47.420 44.258
#> median 53.400 50.300 45.900
#> sd 8.734 10.111 9.836
#> iqr 10.500 12.200 13.200
#> n 467 335 359
#> np 40.2% 28.9% 30.9%
#> NAs 7 9 22
#> zeros 0 0 0
#>
#> Kruskal-Wallis rank sum test:
#> Kruskal-Wallis chi-squared = 115.83, df = 2, p-value < 2.2e-16
#> η² = 0.098 (moderate)
#>
#> Levene's Test for Homogeneity of Variance (center = median):
#> F = 5.3473, num df = 2, denom df = 1158, p-value = 0.004879
#>
#> Warning message:
#> Grouping variable contains 10 NAs (0.8%).
#>
 # store result, print and plot separately
d <- desc(temperature ~ area, Pizza, plotit = FALSE)
d
#> ──────────────────────────────────────────────────────────────────────────────
#> temperature ~ area (Pizza) (Desc.nq)
#>
#> Summary:
#> pairs: 1209, valid: 1161 (96.0%), missings: 48 (4.0%), groups: 3
#>
#> Brent Camden Westminster
#> mean 51.139 47.420 44.258
#> median 53.400 50.300 45.900
#> sd 8.734 10.111 9.836
#> iqr 10.500 12.200 13.200
#> n 467 335 359
#> np 40.2% 28.9% 30.9%
#> NAs 7 9 22
#> zeros 0 0 0
#>
#> Kruskal-Wallis rank sum test:
#> Kruskal-Wallis chi-squared = 115.83, df = 2, p-value < 2.2e-16
#> η² = 0.098 (moderate)
#>
#> Levene's Test for Homogeneity of Variance (center = median):
#> F = 5.3473, num df = 2, denom df = 1158, p-value = 0.004879
#>
#> Warning message:
#> Grouping variable contains 10 NAs (0.8%).
#>
# the three plots
plot(d, which = 1) # boxplots -> plotBox()
# store result, print and plot separately
d <- desc(temperature ~ area, Pizza, plotit = FALSE)
d
#> ──────────────────────────────────────────────────────────────────────────────
#> temperature ~ area (Pizza) (Desc.nq)
#>
#> Summary:
#> pairs: 1209, valid: 1161 (96.0%), missings: 48 (4.0%), groups: 3
#>
#> Brent Camden Westminster
#> mean 51.139 47.420 44.258
#> median 53.400 50.300 45.900
#> sd 8.734 10.111 9.836
#> iqr 10.500 12.200 13.200
#> n 467 335 359
#> np 40.2% 28.9% 30.9%
#> NAs 7 9 22
#> zeros 0 0 0
#>
#> Kruskal-Wallis rank sum test:
#> Kruskal-Wallis chi-squared = 115.83, df = 2, p-value < 2.2e-16
#> η² = 0.098 (moderate)
#>
#> Levene's Test for Homogeneity of Variance (center = median):
#> F = 5.3473, num df = 2, denom df = 1158, p-value = 0.004879
#>
#> Warning message:
#> Grouping variable contains 10 NAs (0.8%).
#>
# the three plots
plot(d, which = 1) # boxplots -> plotBox()
 plot(d, which = 2) # densities -> plotDens()
 plot(d, which = 3) # density + boxplot -> plotDensBox()
 # pipe
desc(temperature ~ area, Pizza) |> plot(which = 2)
# pipe
desc(temperature ~ area, Pizza) |> plot(which = 2)