Visualises the relationship between a numeric variable and a categorical
variable, as computed by DescToolsX::desc(y ~ x) (or x ~ y) for
a numeric/categorical pair. Five panel types are available, selectable
(and combinable) via which.
Usage
# S3 method for class 'Desc.qn'
plot(
  x,
  main = NULL,
  xlab = NULL,
  ylab = NULL,
  which = 2,
  verbose = NULL,
  col = .useTheme,
  box = .useTheme,
  legend = TRUE,
  stamp = .useTheme,
  ...
)
Arguments
- x
an object of class
"Desc.qn", as returned byDescToolsX::desc()for a numeric-categorical pair.- main
main title.
NULL(default) derives a title per panel from the variable names and the panel type (e.g."area ~ delivery_min (Spineplot)"), regardless of the theme'sautoTitle."",NA, orFALSEsuppress the title and compact the top margin. Any other string is used as-is, identically for every selected panel.- xlab
x-axis label.
NULL(default) derives a label specific to each panel: the numeric variable for panels 1, 2, 3 and 5, the categorical variable for panel 4 (boxplot, groups on the x-axis). Supplying a value overrides this for every selected panel.- ylab
y-axis label.
NULL(default) derives a label specific to each panel (e.g."P(y)"for the conditional density,"Density"for the grouped density plot). Supplying a value overrides this for every selected panel.- which
integer vector selecting one or more panels to draw, in the given order. One or more of:
1Conditional density plot (
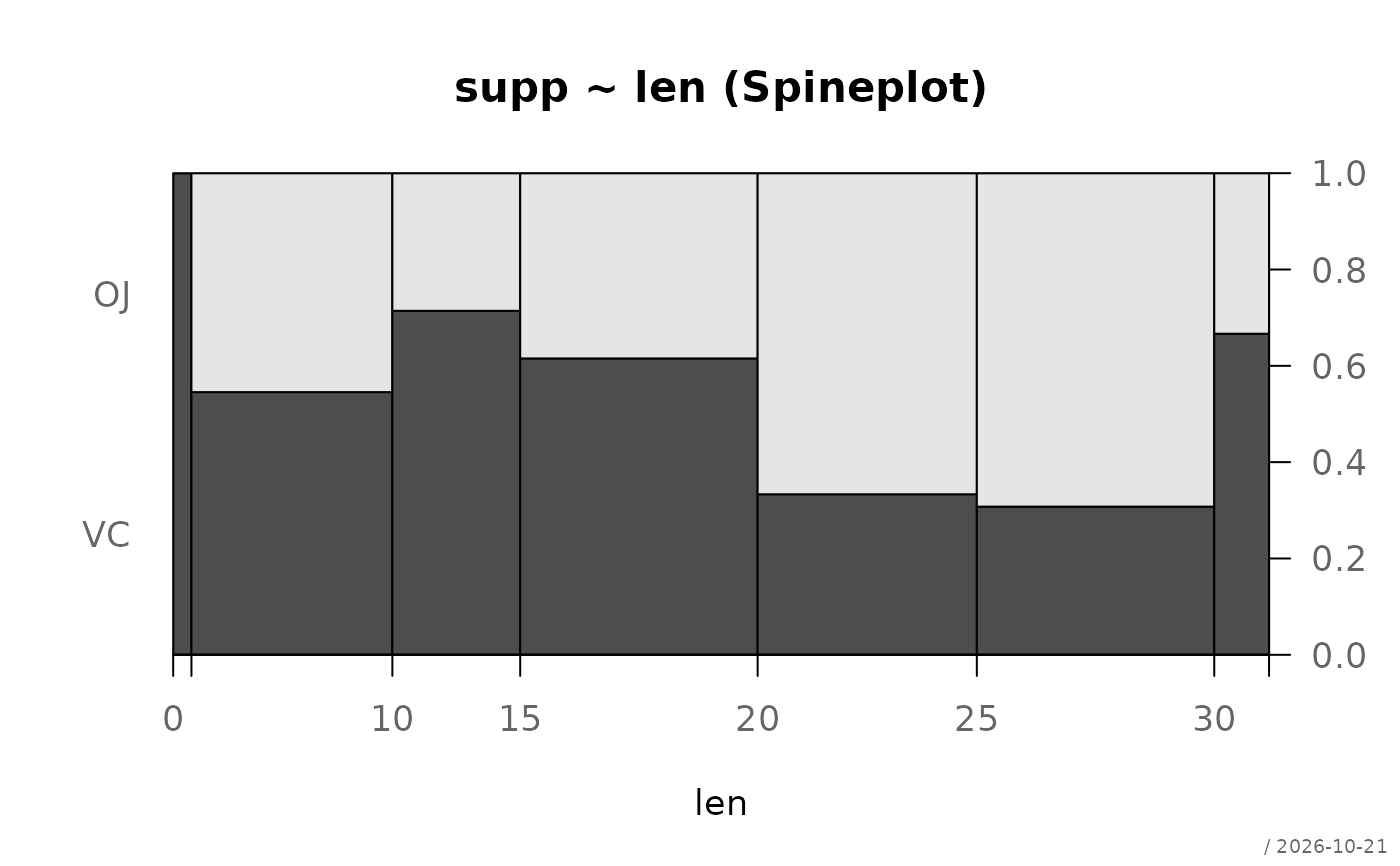
graphics::cdplot()).2Spineplot (
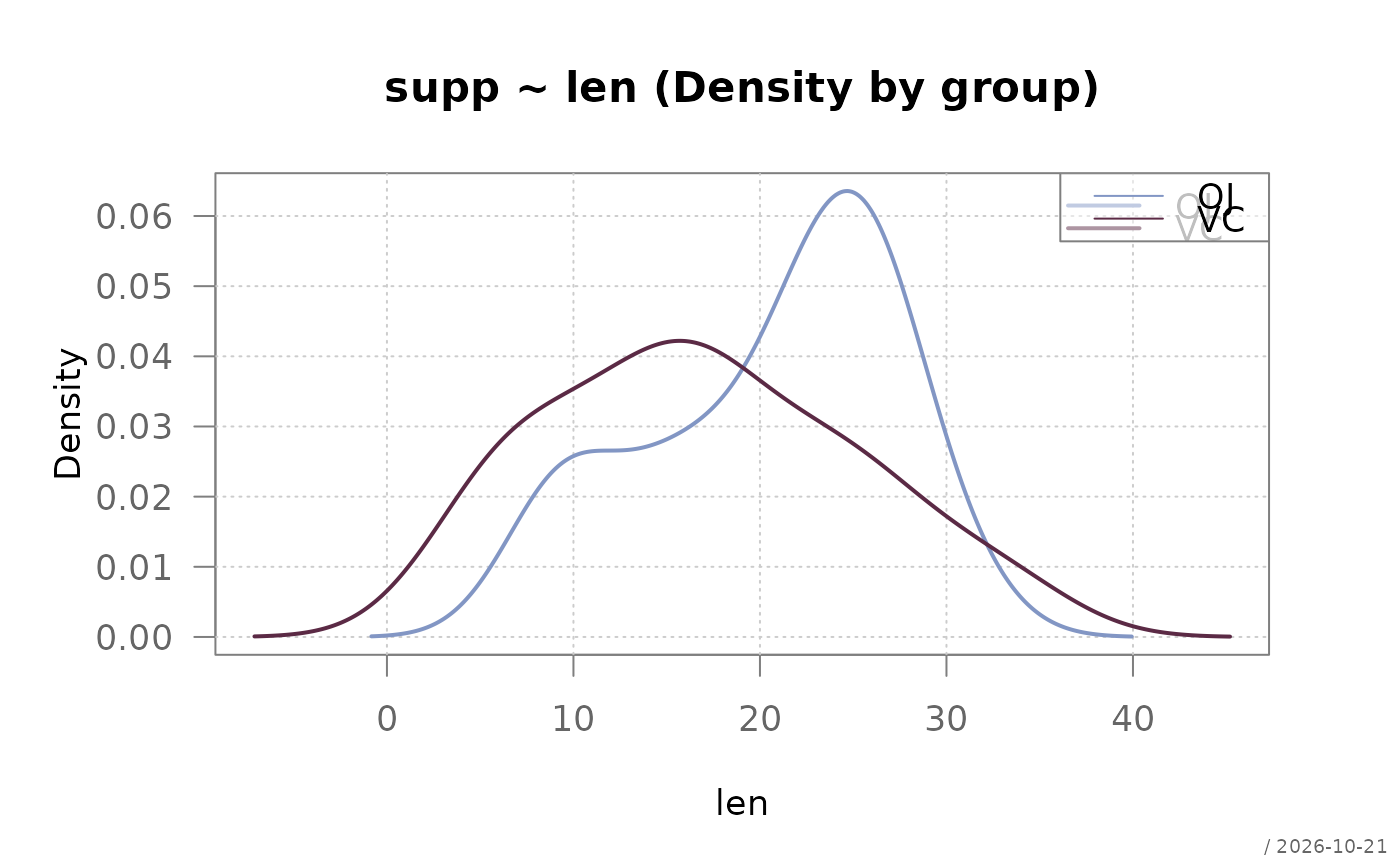
graphics::spineplot()). Default.3Overlapping kernel density curves, one per group (via
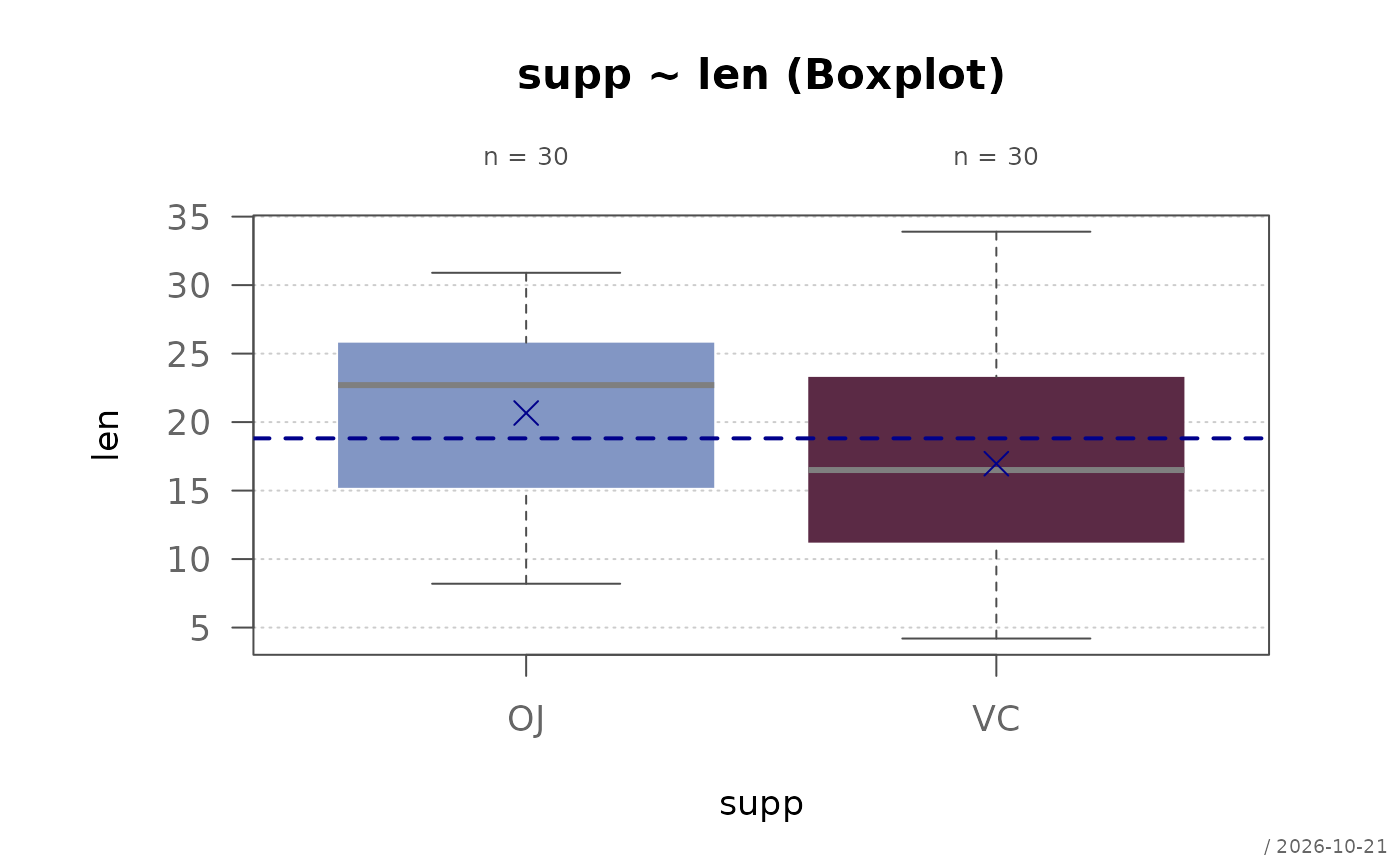
plotDens()).4Boxplot of the numeric variable by group (via
plotBox()).5Prevalence (with Wilson confidence intervals) across quantile bins of the numeric variable. Only available when the categorical variable is binary (
k == 2); a message is issued and the panel skipped otherwise.
Selecting multiple panels does not change the plotting layout (no implicit
mfrow) - arranging multiple panels on one device is left to the caller (e.g.par(mfrow = c(2, 1))beforehand).- verbose
integer; currently computed from
x$meta$verbose/getOption("DescTools.verbose")for consistency with otherplot.Desc.*methods, but not yet consulted to pick a defaultwhich.- col
color specification.
.useTheme(default) resolves a panel-appropriate default rather than one shared color, since fill ramps, categorical sets, and single accents are different things:- panels 1/2
a grey ramp from
"grey30"to"grey90", sized to the number of categorical levels (not theme-driven by design, to keep the unordered category fill neutral - seeplotMosaic()for the same rationale).- panels 3/4
pal(getTheme()$palette), the active theme's qualitative palette, sized to the number of levels.- panel 5
getTheme()$twin[1], the active theme's primary accent color.
Supplying
colexplicitly overrides the default uniformly for every selected panel.- box
controls the plot frame for panels 4 and 5.
.useTheme(default) follows the active theme (getTheme()$box);FALSE/NAsuppress it; a named list overridesgraphics::box()arguments. Panels 1/2 (cdplot()/spineplot()) have no effect from this argument - they always draw their native frame unconditionally, with no toggle to override it. Panel 4 (plotBox()) always draws its own frame regardless of this argument. Panel 3 (plotDens()) never draws a frame, regardless of this argument.- legend
controls the legend for panel 3 (grouped density curves).
TRUE(default) draws a legend with the group levels.FALSE/NAsuppresses it. A named list overrides arguments forwarded tographics::legend(). Has no effect on the other panels.- stamp
controls the corner stamp.
.useTheme(default) resolves togetTheme()$stamp, drawn once after all selected panels (panels 3/4 delegate toplotDens()/plotBox(), whose own stamp is suppressed internally to avoid a duplicate).TRUE/FALSE/NULL, a string, or a named list forstamp().- ...
further graphical parameters, passed to
par()via the internal framework and to the underlying panel-drawing functions (cdplot(),spineplot(),plotDens(),plotBox(), orgraphics::plot(), depending on the selected panel).
Details
The left margin is sized automatically from the longest of: the
(possibly panel-specific) y-axis labels, and - for panels 1/2 - the
categorical level names drawn as axis tick labels, so neither is ever
clipped regardless of which.
See also
DescToolsX::desc, plotDens(), plotBox(),
graphics::cdplot(), graphics::spineplot()
Other plot.s3:
plot.BlandAltman(),
plot.Desc.table(),
plot.Lc()
Examples
# the object is built by hand here; normally DescToolsX::desc(y ~ x)
# returns it for a numeric-categorical pair
d <- structure(list(
res = list(xOk = ToothGrowth$len,
yOk = ToothGrowth$supp,
lvls = levels(ToothGrowth$supp),
k = nlevels(ToothGrowth$supp)),
meta = list(xname = "len", yname = "supp")
), class = "Desc.qn")
plot(d) # spineplot
 plot(d, which = 3) # density by group
 plot(d, which = 4) # boxplot by group