Visualize objects of class "Lc" and "LcList" returned by
DescToolsX::lc(). The plot() method draws a new
Lorenz curve plot including the line of perfect equality; lines()
and points() add to an existing plot.
Usage
# S3 method for class 'Lc'
plot(
  x,
  main = NULL,
  xlab = NULL,
  ylab = NULL,
  xlim = NULL,
  ylim = NULL,
  general = FALSE,
  col = NULL,
  line = TRUE,
  points = NULL,
  eqline = TRUE,
  grid = .useTheme,
  box = .useTheme,
  cband = NA,
  stamp = .useTheme,
  ...
)

# S3 method for class 'Lc'
lines(x, general = FALSE, col = NULL, lwd = 2, lty = 1, cband = NA, ...)

# S3 method for class 'Lc'
points(x, general = FALSE, pch = 16, col = NULL, ...)

# S3 method for class 'LcList'
lines(x, col = NULL, ...)

# S3 method for class 'LcList'
points(x, col = NULL, ...)

# S3 method for class 'LcList'
plot(x, col = NULL, general = FALSE, ylim = NULL, ...)
Arguments
- x
object of class
"Lc"(forplot.Lc(),lines.Lc(),points.Lc()) or"LcList"(for the*.LcList()methods).- main, xlab, ylab
main title and axis labels, used by
plot.Lc()only. All default toNULL: no title,"p", and"L(p)"("GL(p)"ifgeneral = TRUE), respectively.- xlim, ylim
numeric vectors of length 2 giving axis limits, used by
plot.Lc()andplot.LcList(). DefaultNULL, which resolves toc(0, 1)forxlimand, forylim, toc(0, 1)for the standard andc(0, max(L))for the generalized curve.- general
logical. If
TRUE, the generalized Lorenz curve (scaled by the mean) is displayed instead of the standard curve. Default isFALSE.- col
color of curve and symbols. For
plot.Lc(),lines.Lc()andpoints.Lc()a single color (defaultNULL, i.e."black"inplot.Lc()and the device default in the low-level methods). For the"LcList"methods a vector recycled to the number of groups (defaultNULL, i.e.seq_len(k)).- line
logical or list, used by
plot.Lc()to control drawing of the Lorenz curve.TRUE(default) draws it with package defaults (lty = 1,lwd = 2);FALSEsuppresses it (and the confidence band); a list overrides individual defaults and is forwarded tolines.Lc().- points
NULL, logical or list, used byplot.Lc()to control drawing of symbols on the curve.NULL(default) is automatic: symbols are drawn only while the curve has at mostgetOption("DescToolsX.plot.maxSymbols")knots (100 by default), which keeps large samples legible.TRUEalways draws them with package defaults (pch = 21,bg = "white",cex = 1.4);FALSEsuppresses them; a list overrides individual defaults and is forwarded topoints.Lc().- eqline
logical or list, used by
plot.Lc()only. Controls the line of perfect equality:TRUE(default) draws it with package defaults (col = "grey50",lty = 2),FALSEsuppresses it, a list is forwarded tographics::abline(). Its slope is1for the standard andmax(L)for the generalized curve; overridinga/bis possible but rarely sensible.- grid, box
callIf-style specs for the grid and the box around the plot region, used by
plot.Lc()only..useTheme(default) letsgetTheme()decide,TRUE/FALSEforce drawing/suppression, and a named list is forwarded tographics::grid()resp.graphics::box().- cband
used by
plot.Lc()andlines.Lc().NAto suppress the confidence band (default), or a list of arguments passed toDescToolsX::predict.Lc()to control bootstrap confidence intervals.- stamp
controls the corner stamp.
.useTheme(default) resolves togetTheme()$stamp.TRUE/FALSE/NULL, a string, or a named list forstamp().- ...
further arguments. For
plot.Lc(), graphical parameters passed tographics::par()via.applyParFromDots()(e.g.mar,cex.axis,las). Forlines.Lc()andpoints.Lc(), further arguments passed on tographics::lines()andgraphics::points(), respectively. Forplot.LcList(), arguments are passed toplot.Lc()for the first group and, restricted to those the low-level method understands, tolines.Lc()for the remaining ones.- lwd
line width, used by
plot.Lc()(vialine) andlines.Lc(). Default is2.- lty
line type, used by
plot.Lc()(vialine) andlines.Lc(). Default is1.- pch
plotting symbol, used by
points.Lc()only. Default is16.
Details
For "LcList" objects (grouped Lorenz curves), plot() draws
the first group and overlays the remaining groups with lines().
Colors cycle automatically when col is not supplied and are
recycled to the number of groups otherwise.
The curve of plot.Lc() is drawn by lines.Lc() and the
symbols by points.Lc(), so all three methods share one code path
and one set of semantics - including the confidence band, which is
controlled by cband in plot.Lc() exactly as it is in
lines.Lc(). Pass a list of arguments to
DescToolsX::predict.Lc() to control the bootstrap (e.g.
cband = list(conf.level = 0.90, n = 500)). Set
cband = NA (default) to suppress the band. Note that
line = FALSE suppresses the band along with the curve.
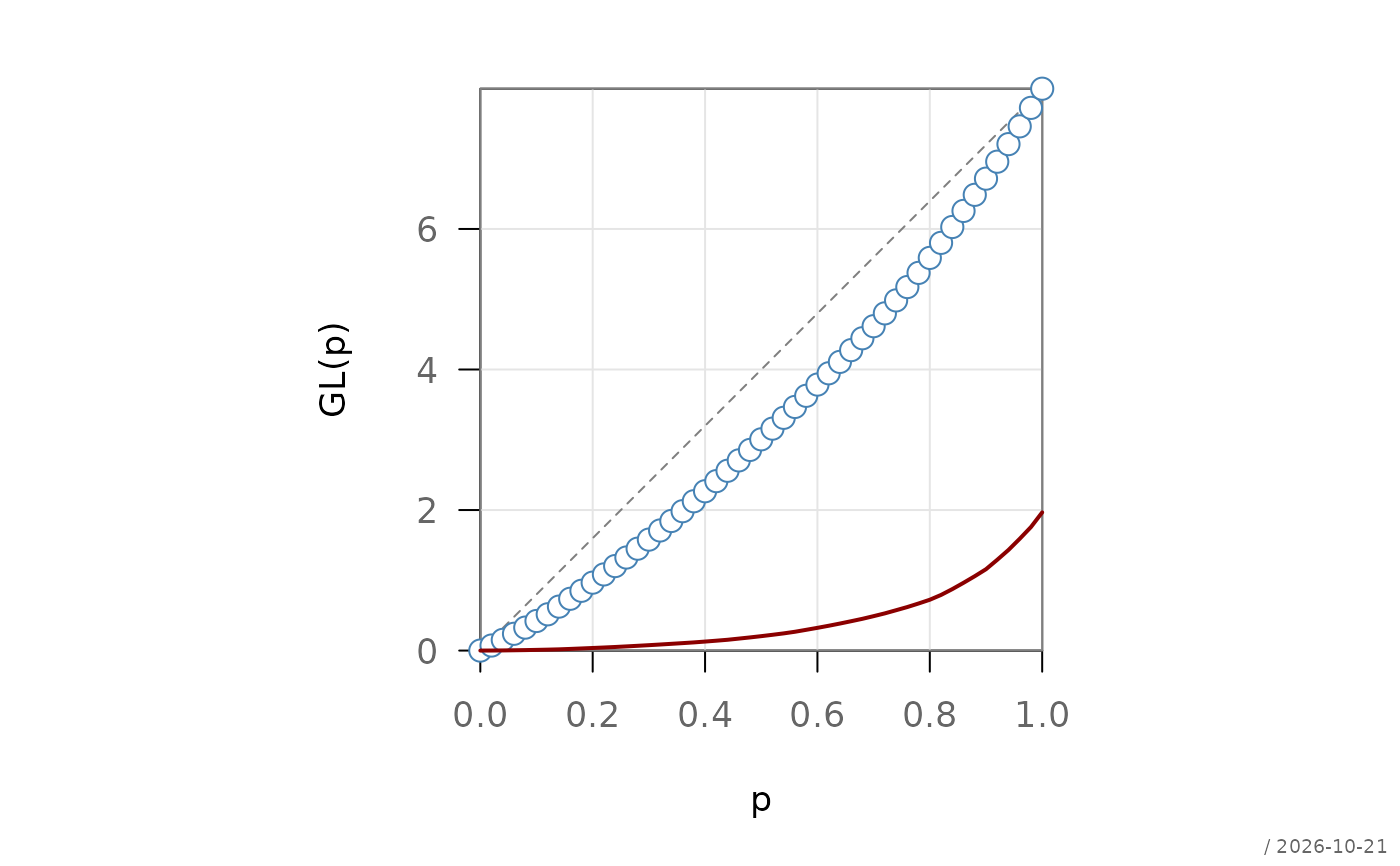
With general = TRUE the generalized Lorenz curve is displayed.
It ends at the mean rather than at 1, so the default ylim and the
slope of the equality line follow the data; for "LcList" objects
the panel is sized to accommodate all groups, not just the first.
See also
DescToolsX::lc() for computing the Lorenz curve,
DescToolsX::predict.Lc() for bootstrap confidence
intervals, DescToolsX::gini() for the Gini coefficient.
Other plot.s3:
plot.BlandAltman(),
plot.Desc.qn(),
plot.Desc.table()
Examples
# Lorenz curve objects are built by hand here; normally
# DescToolsX::lc() returns them
lorenz <- function(v) {
v <- sort(v)
L <- c(0, cumsum(v)) / sum(v)
structure(list(p = c(0, seq_along(v)) / length(v),
L = L, L.general = L * mean(v)),
class = "Lc")
}
set.seed(4)
even <- lorenz(rgamma(50, shape = 8))
skewed <- lorenz(rlnorm(50, sdlog = 1.2))
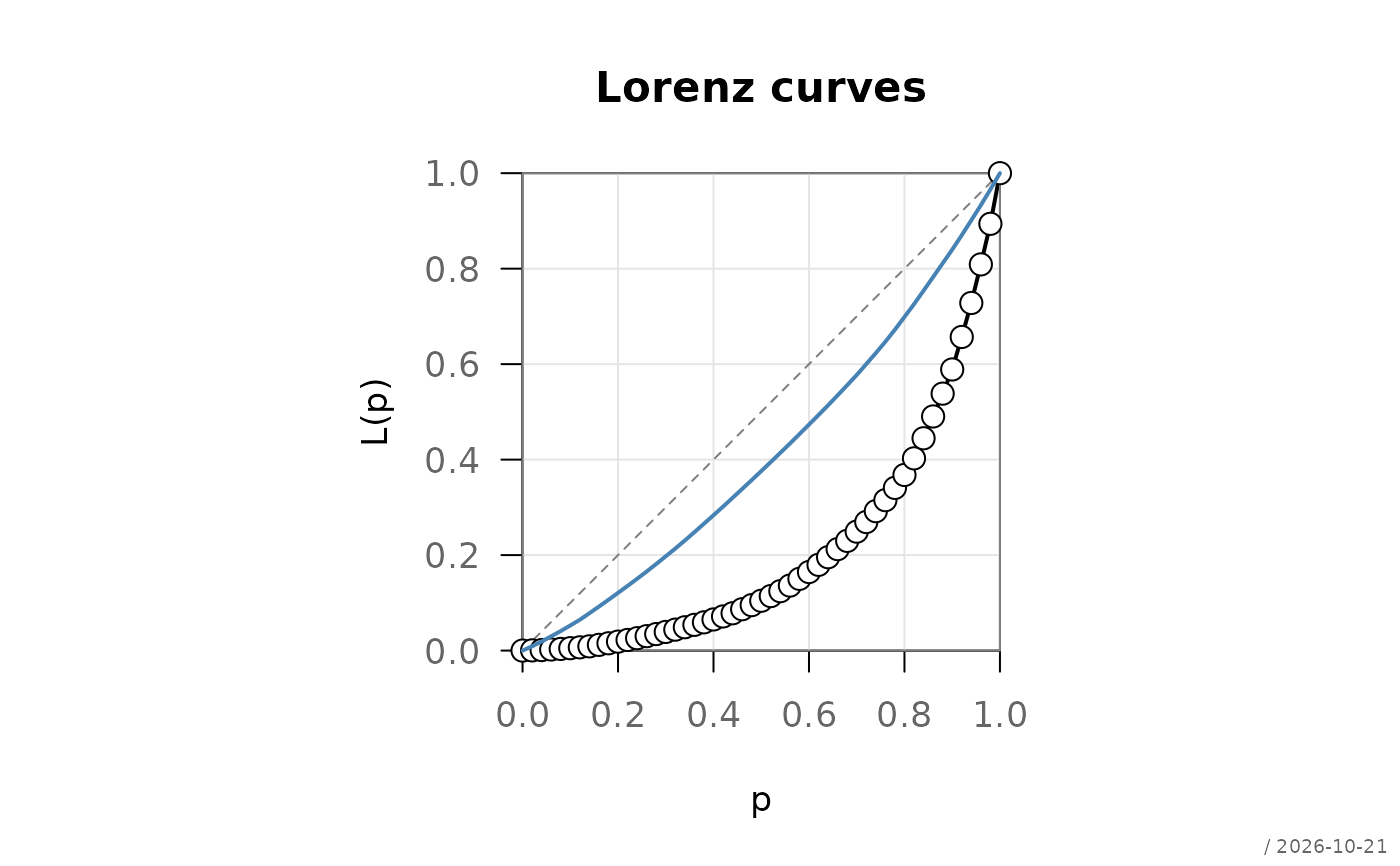
plot(skewed, main = "Lorenz curves")
lines(even, col = "steelblue")
 # several groups at once, generalized curves
grp <- structure(list(even = even, skewed = skewed), class = "LcList")
plot(grp, general = TRUE, col = c("steelblue", "darkred"))
# several groups at once, generalized curves
grp <- structure(list(even = even, skewed = skewed), class = "LcList")
plot(grp, general = TRUE, col = c("steelblue", "darkred"))