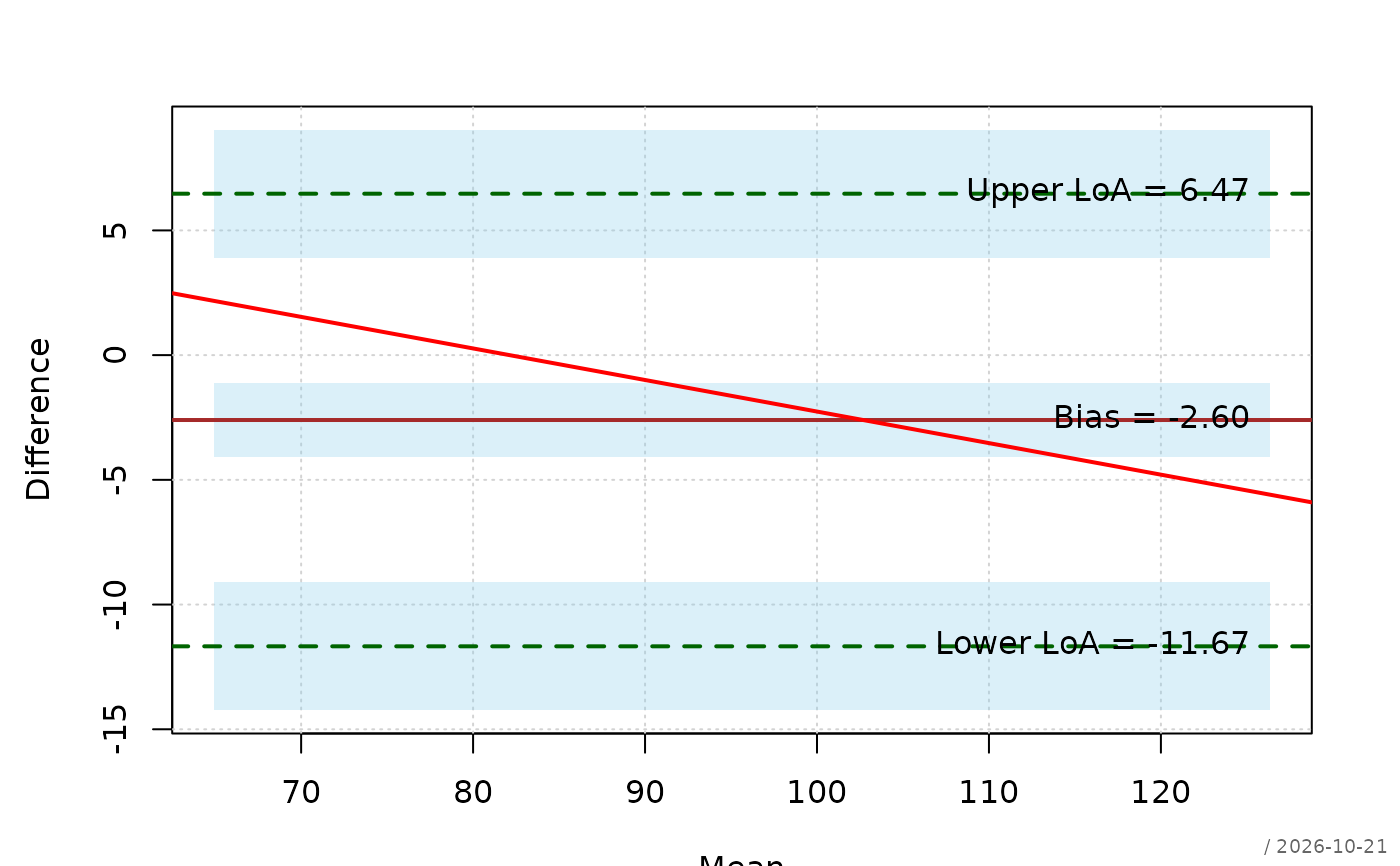
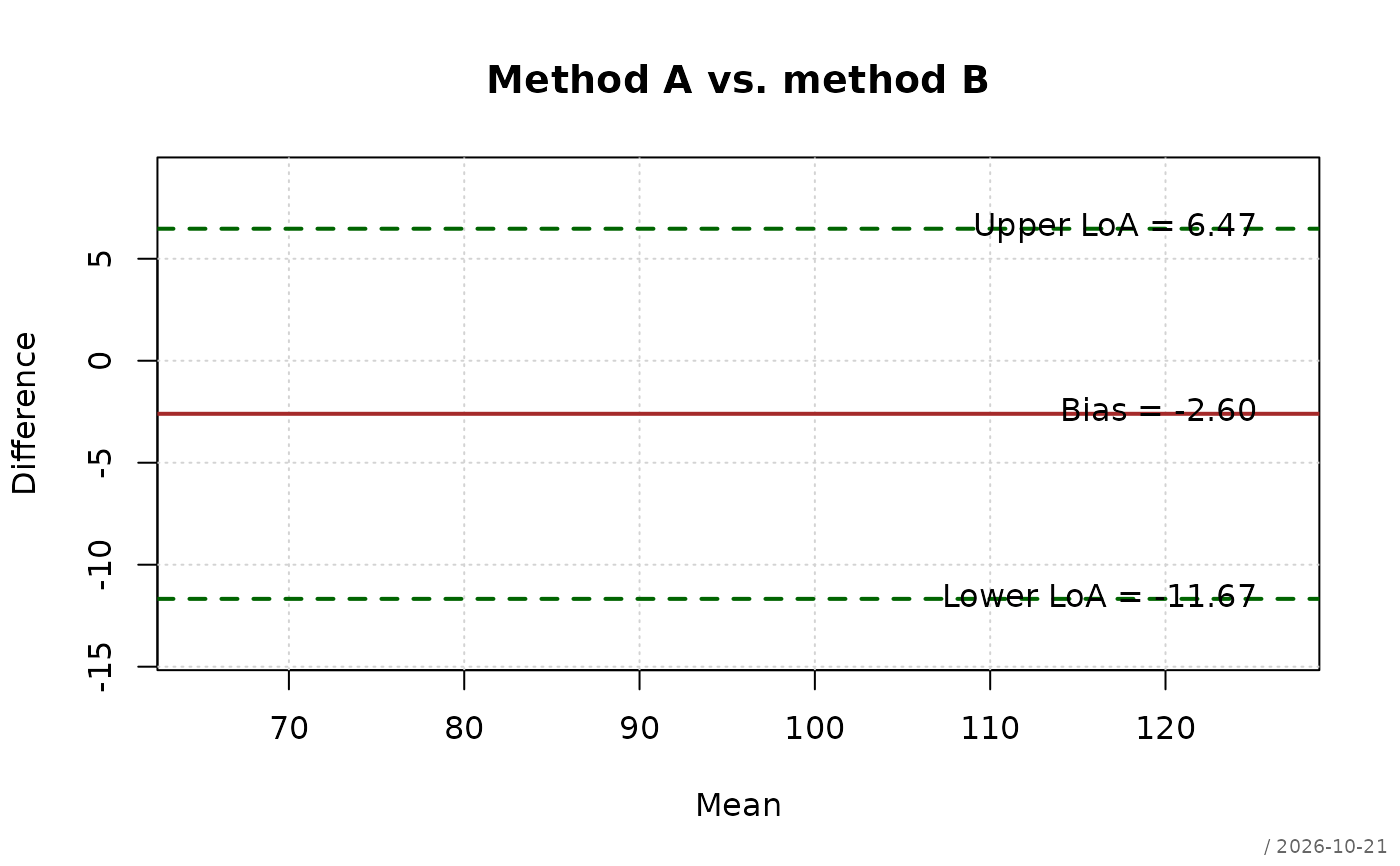
Plots a Bland-Altman agreement analysis.
Usage
# S3 method for class 'BlandAltman'
plot(
  x,
  main = "",
  xlab = "Mean",
  ylab = "Difference",
  xlim = NULL,
  ylim = NULL,
  pch = 16,
  col = NULL,
  grid = TRUE,
  meanLine = TRUE,
  limits = TRUE,
  cband = FALSE,
  trend = FALSE,
  showText = TRUE,
  stamp = NULL,
  ...
)
Arguments
- x
an object of class
"BlandAltman".- main
plot title.
- xlab
X-axis label.
- ylab
Y-axis label.
- xlim
X-axis limits.
- ylim
Y-axis limits.
- pch
plotting symbol.
- col
point colour.
- grid
logical; draw a background grid.
- meanLine
logical; draw the bias line.
- limits
logical; draw the limits of agreement.
- cband
logical; draw confidence bands.
- trend
logical; draw a regression line of differences versus means.
- showText
logical; annotate bias and limits.
- stamp
optional plot stamp.
- ...
further arguments passed to
plot().
Details
Objects of class "BlandAltman" are typically created with
DescToolsX::blandAltmanData(). The method uses the elements mean
and diff (one value per pair), bias, loaLower and loaUpper, and
for the confidence bands biasCI, loaLowerCI and loaUpperCI (each
a vector of length 2).
See also
Other plot.s3:
plot.Desc.qn(),
plot.Desc.table(),
plot.Lc()
Examples
# two measurement methods applied to the same 40 subjects; the object is
# built by hand here, normally DescToolsX::blandAltmanData() returns it
set.seed(1)
a <- rnorm(40, mean = 100, sd = 15)
b <- a + rnorm(40, mean = 2, sd = 5)
d <- a - b
n <- length(d)
s <- sd(d)
tq <- qt(0.975, df = n - 1)
loa <- mean(d) + c(-1, 1) * 1.96 * s
seLoa <- sqrt(3 * s^2 / n)
ba <- structure(list(
mean = (a + b) / 2,
diff = d,
bias = mean(d),
biasCI = mean(d) + c(-1, 1) * tq * s / sqrt(n),
loaLower = loa[1],
loaUpper = loa[2],
loaLowerCI = loa[1] + c(-1, 1) * tq * seLoa,
loaUpperCI = loa[2] + c(-1, 1) * tq * seLoa
), class = "BlandAltman")
plot(ba, main = "Method A vs. method B")
 plot(ba, cband = TRUE, trend = TRUE)