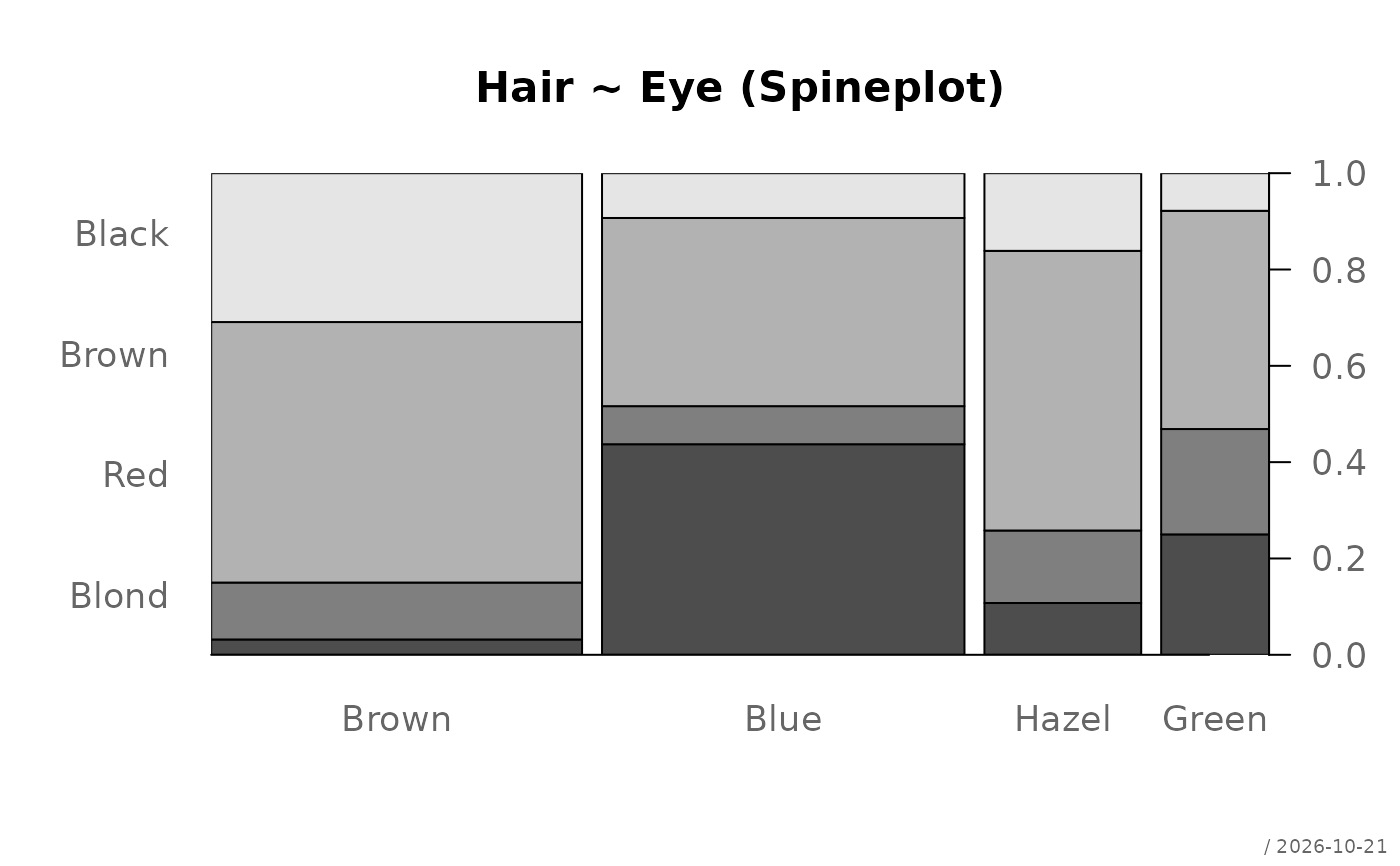
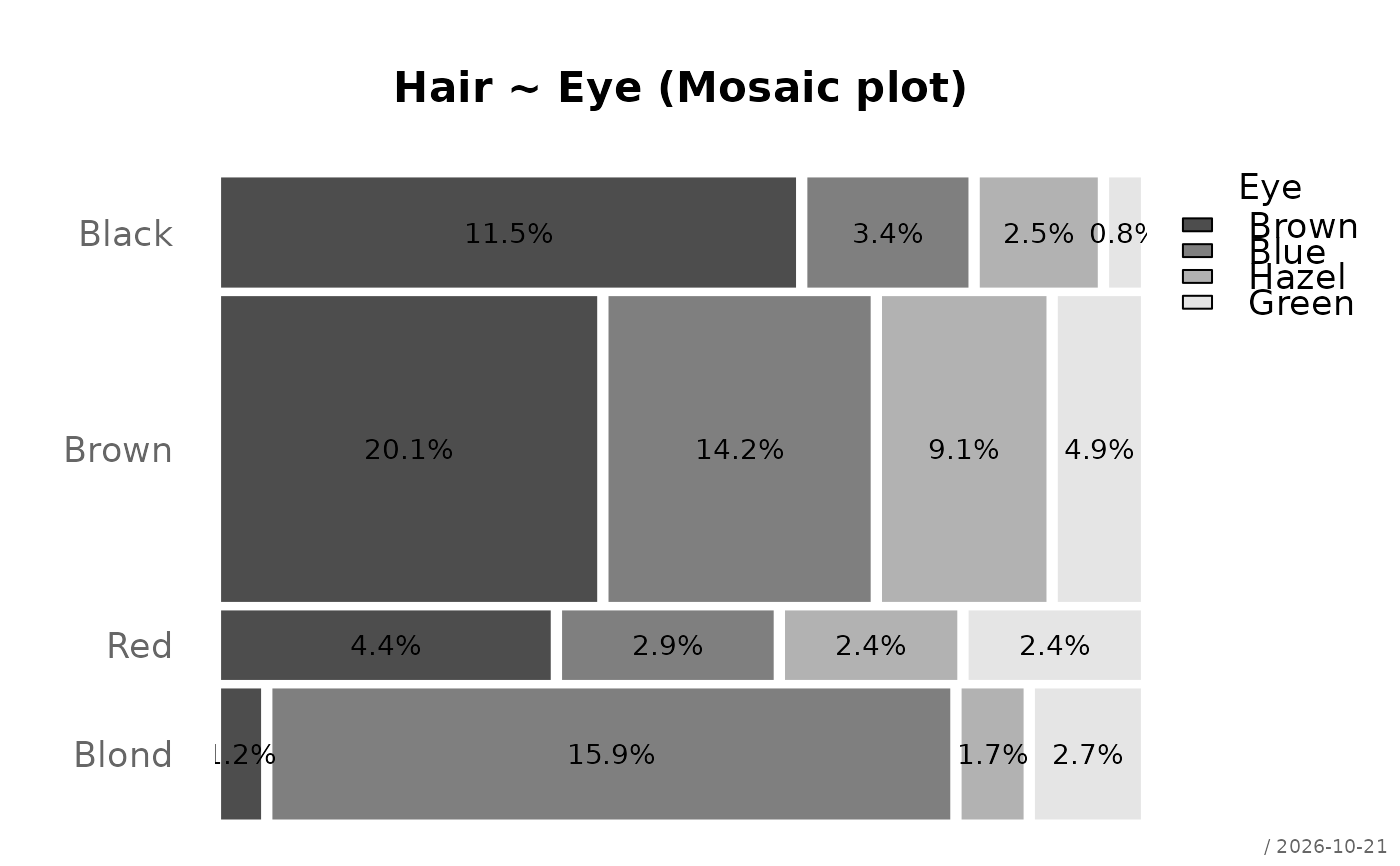
Visualises a (two-dimensional) cross-tabulation, as computed by
DescToolsX::desc() for a categorical/categorical pair.
Four panel types are available, selectable (and combinable) via
which. Higher-dimensional tables (more than two margins) are not
supported; a message is issued and the call returns invisibly.
Usage
# S3 method for class 'Desc.table'
plot(
  x,
  main = NULL,
  xlab = NULL,
  ylab = NULL,
  which = 1,
  verbose = NULL,
  col = .useTheme,
  box = .useTheme,
  stamp = .useTheme,
  ...
)
Arguments
- x
an object of class
"Desc.table", as returned byDescToolsX::desc()for a categorical-categorical pair.- main
main title.
NULL(default) derives a title per panel fromx$meta$xname(the deparsed expression originally passed todesc(), e.g."table(Pizza$area, Pizza$driver)") combined with a panel-type label for context when multiple panels are shown (e.g."table(Pizza$area, Pizza$driver) (Spineplot)"). There is noy ~ xpair to draw on here -x$metacarries only a singlexname, since a table built outside a two-sided formula has no separately named "x" and "y" variable. Drawn regardless of the theme'sautoTitle."",NA, orFALSEsuppress the title and compact the top margin. Any other string is used as-is, identically for every selected panel.- xlab
x-axis label.
NULL(default) leaves the panel's own default in place (empty for the spineplot, the table name for the mosaic plots, the column dimnames for the association plot). Supplying a value overrides this for every selected panel.- ylab
y-axis label.
NULL(default) leaves the panel's own default in place (typically empty/unlabeled, since the row dimension of a table built via e.g.table(a, b)usually has no name carried inx$meta). Supplying a value overrides this for every selected panel.- which
integer vector selecting one or more panels to draw, in the given order. One or more of:
1Spineplot (
graphics::spineplot()). Default.2Mosaic plot (via
plotMosaic()).3Mosaic plot (swapped axis).
4Association plot (Cohen-Friendly plot) via
plotAssoc().5Heatmap of cell proportions (via
plotHeatmap(),scale = "prop").
Selecting multiple panels does not change the plotting layout (no implicit
mfrow) - as with otherplot.Desc.*methods, arranging multiple panels on one device is left to the caller (e.g.par(mfrow = c(2, 1))beforehand).- verbose
integer; currently computed from
x$meta$verbose/getOption("DescTools.verbose")for consistency with otherplot.Desc.*methods, but not yet consulted to pick a defaultwhich.- col
color specification.
.useTheme(default) resolves a panel-appropriate default rather than one shared color, since fill ramps, diverging palettes, and sequential heat scales are different things:- panel 1
a grey ramp from
"grey30"to"grey90", sized to the number of rows oftab- the panel drawsspineplot(t(tab)), so the stacked (filled) dimension is the row dimension oftab, not its columns (not theme-driven by design, to keep the unordered category fill neutral).- panel 2
a grey ramp from
"grey30"to"grey90", sized to the number of columns oftab(the fill dimension of the untransposed mosaic), passed toplotMosaic().- panel 3
a grey ramp from
"grey30"to"grey90", sized to the number of rows oftab- withswap = TRUEthe fill dimension is the row dimension, passed toplotMosaic().- panel 4
left at
plotAssoc()'s own default (pal("red-white-blue-3", n = 100)), a diverging palette - cell colors there encode the sign and strength of Pearson residuals, so a categorical or grey-ramp default would not be meaningful. Supplyingcoloverrides this with the diverging palette of the user's choice.- panel 5
left at
plotHeatmap()'s own default (pal("Blues", n = 100)), a sequential ramp - cell colors there encode magnitude only. Supplyingcoloverrides this.
Supplying
colexplicitly overrides the default uniformly for every selected panel.- box
controls the plot frame.
.useTheme(default) follows the active theme (getTheme()$box);FALSE/NAsuppress it; a named list overrides frame-drawing arguments.- panel 1
has no effect -
spineplot()always draws its native frame unconditionally, with no toggle to override it.- panels 2/3
plotMosaic()always draws its own frame; this argument has no effect.- panel 4
plotAssoc()has no frame/box concept of its own (it draws dashed reference lines instead); this argument has no effect.- panel 5
forwarded as-is to
plotHeatmap()'s ownboxargument, which draws the outer frame viarect()at the exact tile boundaries rather thangraphics::box().
- stamp
controls the corner stamp.
.useTheme(default) resolves togetTheme()$stamp, drawn once after all selected panels. Panels 2-5 delegate toplotMosaic()/plotAssoc()/plotHeatmap(), whose ownstampargument is set toNAinternally to avoid a duplicate.TRUE/FALSE/NULL, a string, or a named list forstamp().- ...
further graphical parameters, passed to
par()via the internal framework and to the underlying panel-drawing functions (spineplot(),plotMosaic(),plotAssoc(), orplotHeatmap(), depending on the selected panel).
Details
The left margin is sized automatically from the longest of: the y-axis
label, and - for panels 1/2 - the row names of tab drawn as
axis tick labels, so neither is ever clipped regardless of which.
Only two-dimensional tables are supported. If x carries a table
with more than two margins, a message is issued and the function returns
invisibly without drawing anything.
See also
DescToolsX::desc, plotAssoc(),
plotHeatmap(), plotMosaic(),
graphics::spineplot()
Other plot.s3:
plot.BlandAltman(),
plot.Desc.qn(),
plot.Lc()