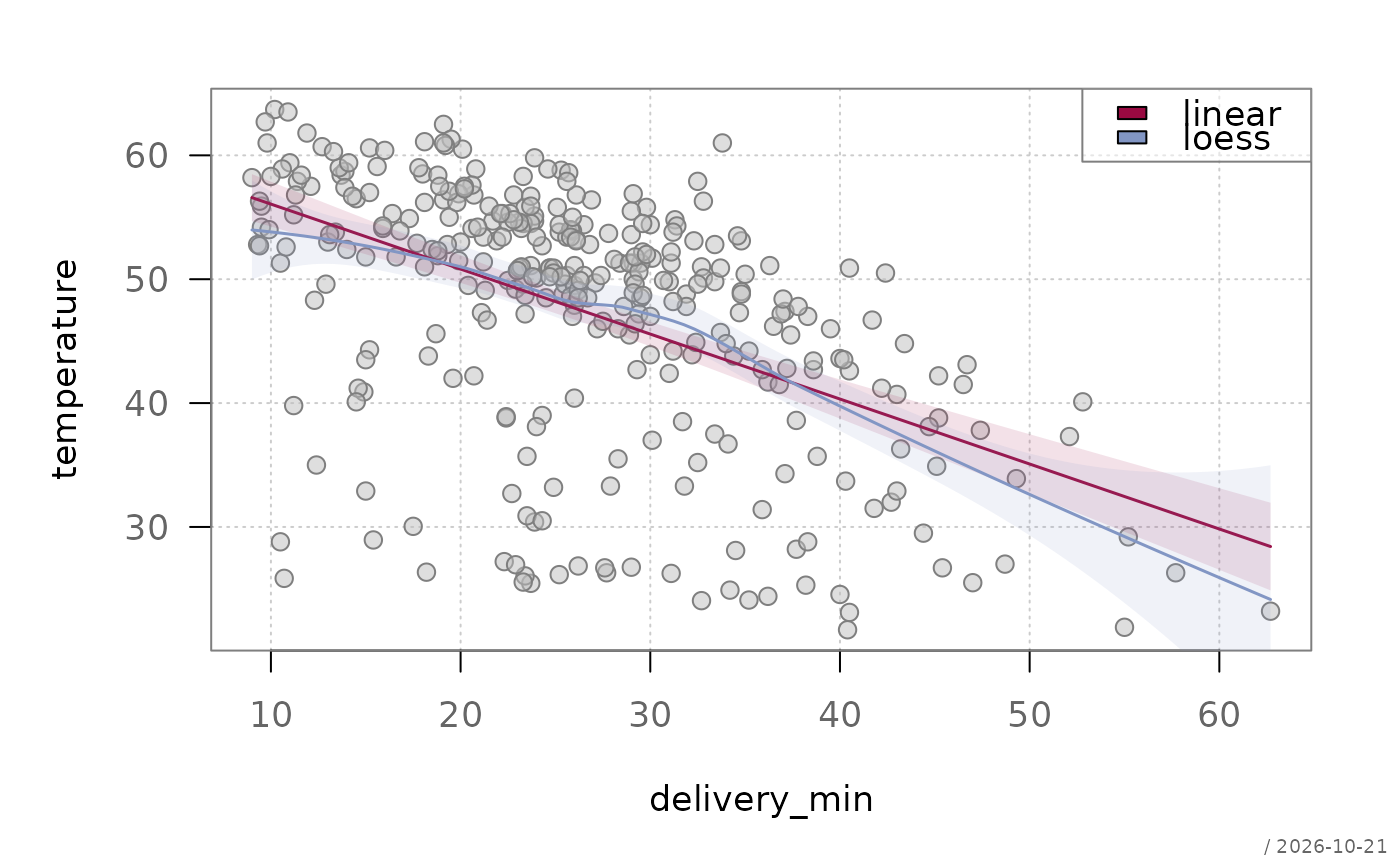
Draws a scatterplot of two numeric variables with optional linear and locally weighted regression lines, and an optional legend.
Usage
plotXY(x, ...)

# Default S3 method
plotXY(
  x,
  y,
  main = NULL,
  xlab = "",
  ylab = "",
  xlim = NULL,
  ylim = NULL,
  col = .useTheme,
  bg = .useTheme,
  pch = .useTheme,
  cex = .useTheme,
  grid = .useTheme,
  box = .useTheme,
  lm = TRUE,
  loess = TRUE,
  legend = TRUE,
  stamp = .useTheme,
  ...
)

# S3 method for class 'formula'
plotXY(
  formula,
  data,
  subset,
  na.action = na.omit,
  main = NULL,
  xlab = "",
  ylab = "",
  ...
)
Arguments
- x
numeric vector of x-values, or a formula of the form
y ~ x.- ...
further graphical parameters passed to
par()via the internal framework.- y
numeric vector of y-values (ignored if a formula is used).
- main
main title.
NULL(default) draws none, unless the theme setsautoTitle = TRUE(see theme); the title is then derived from the input:y ~ xfor the default method, or the formula."",NAorFALSEalways suppress it and compact the top margin; any other string is used as given.- xlab
label for the x-axis.
- ylab
label for the y-axis.
- xlim
numeric vector of length 2; x-axis limits. If
NULL(default), the range ofxis used.- ylim
numeric vector of length 2; y-axis limits. If
NULL(default), the range ofyis used.- col
color of the points.
.useTheme(default) resolves togetTheme()$points$col.- bg
background (fill) color of the points.
.useTheme(default) resolves togetTheme()$points$bg.- pch
plotting character.
.useTheme(default) resolves togetTheme()$points$pch.- cex
character expansion factor for points.
.useTheme(default) resolves togetTheme()$points$cex.- grid
controls drawing of the background grid. Can be:
.useTheme(default): follow the active theme (getTheme()$grid)TRUE: draw grid with theme settingsFALSE,NULL, orNA: suppress grida named list: arguments passed to
graphics::grid(), overriding the theme defaults for this call only
- box
controls drawing of the plot box. Can be:
.useTheme(default): follow the active theme (getTheme()$box)TRUE: draw box with theme settingsFALSE,NULL, orNA: suppress boxa named list: arguments passed to
graphics::box(), overriding the theme defaults for this call only
- lm
controls drawing of the linear regression line. Can be:
TRUE: draw with default settingsFALSE,NULL, orNA: suppressa named list: arguments passed to
graphics::lines(), e.g.list(col = "blue", lwd = 2)
- loess
controls drawing of the locally weighted regression line. Can be:
TRUE: draw with default settingsFALSE,NULL, orNA: suppressa named list: arguments passed to
graphics::lines(), e.g.list(col = "red", lty = "dashed")
- legend
controls drawing of the legend. Can be:
TRUE: draw with default settings (position"topright")FALSE,NULL, orNA: suppressa named list: arguments passed to
graphics::legend(), e.g.list(x = "bottomleft")
The legend is only drawn when at least one of
lmorloessis active.lm/loessline colors are taken from the active theme'stwincolors (getTheme()$twin).- stamp
controls the corner stamp.
.useTheme(default) resolves togetTheme()$stamp.TRUE/FALSE/NULL, a string, or a named list forstamp().- formula
a formula of the form
y ~ x, both numeric.- data
an optional data frame containing variables in the formula.
- subset
an optional expression indicating which observations to use, evaluated in
data(subset = delivery_min < 40), as inplot.formula().- na.action
a function specifying how missing values are handled. Defaults to
na.omit.
Details
Optional plot components (grid, box, lm,
loess, legend) follow bedrock::callIf()
semantics:
TRUE: draw with defaultsFALSE,NULL, orNA: suppress componentnamed list: customize component arguments
col, bg, pch, cex, grid, and box
default to .useTheme, deferring to the package's active theme
(see theme) rather than a hardcoded value. This means
setTheme(list(points = list(col = "black"))) changes the point
color for every call to plotXY() (and any other function using
the same theme section) that doesn't override col explicitly.
See also
graphics::plot(),
stats::lm(),
stats::loess(),
bedrock::callIf()
Other plot.bivariate:
plotAssoc(),
plotBag(),
plotCor(),
plotDens2D(),
plotHeatmap(),
plotHexbin(),
plotMosaic()
Examples
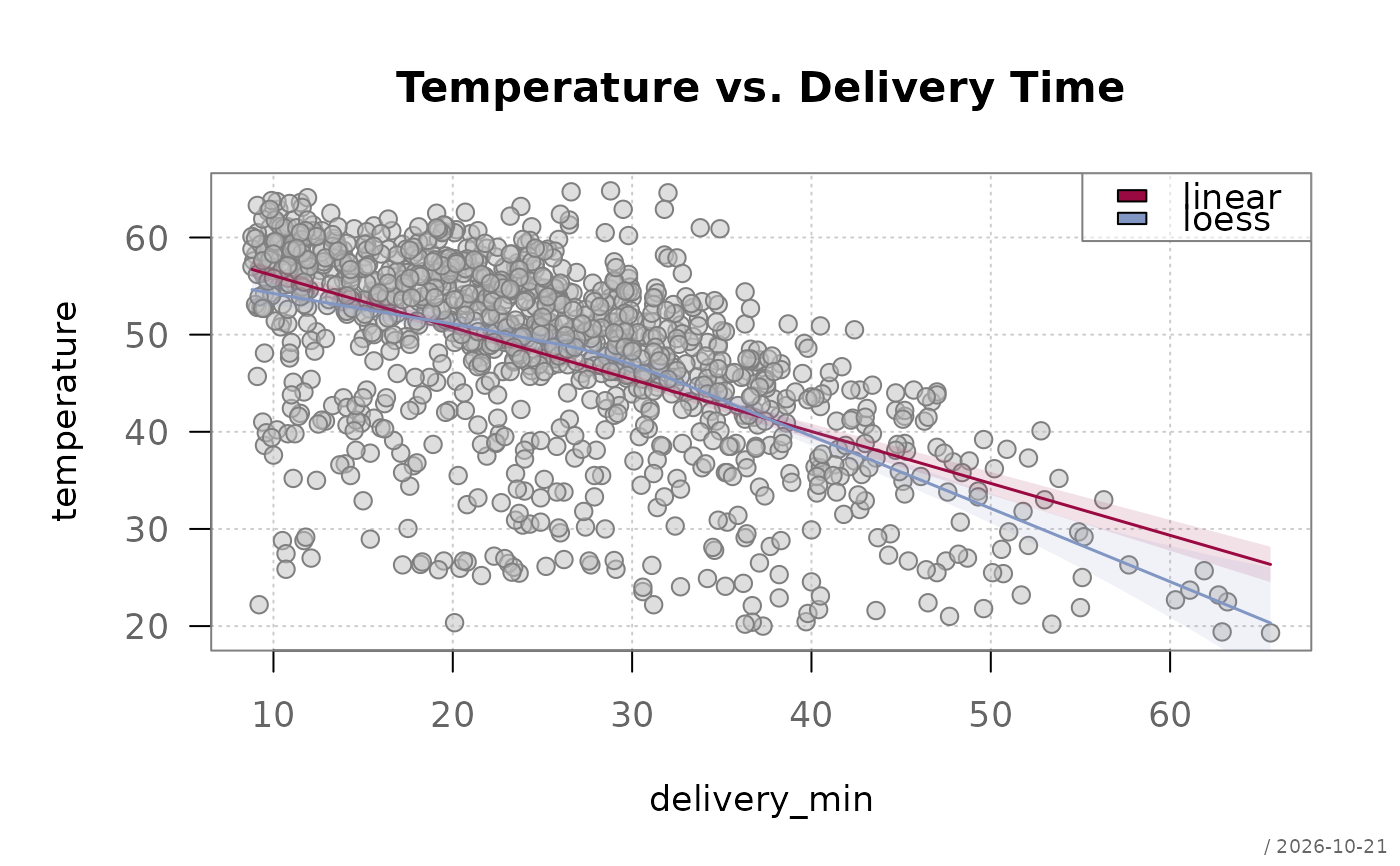
plotXY(temperature ~ delivery_min, bedrock::Pizza,
main = "Temperature vs. Delivery Time")
 # Suppress loess, customize lm line
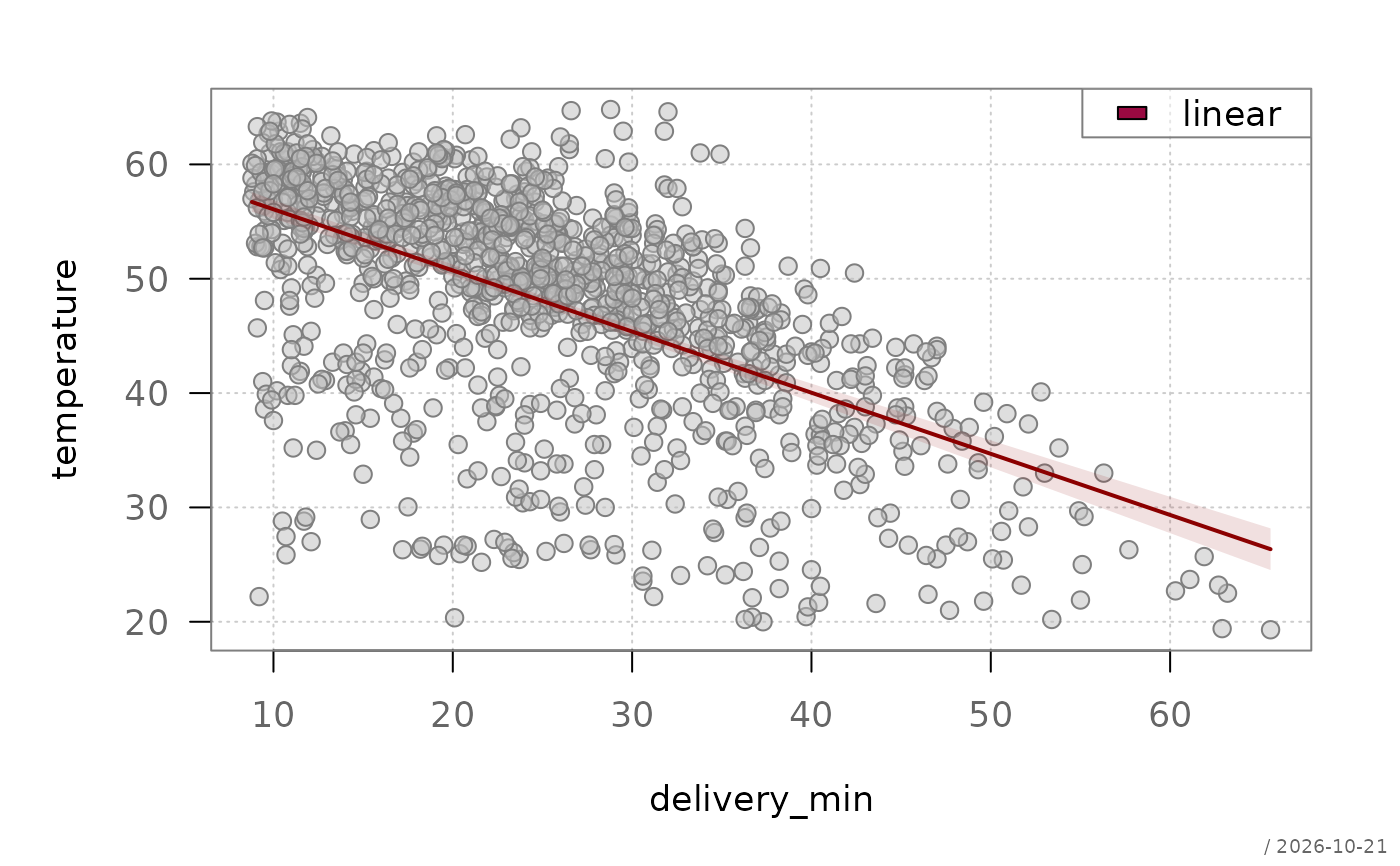
plotXY(temperature ~ delivery_min, bedrock::Pizza,
lm = list(col = "darkred", lwd = 2),
loess = FALSE)
# Suppress loess, customize lm line
plotXY(temperature ~ delivery_min, bedrock::Pizza,
lm = list(col = "darkred", lwd = 2),
loess = FALSE)
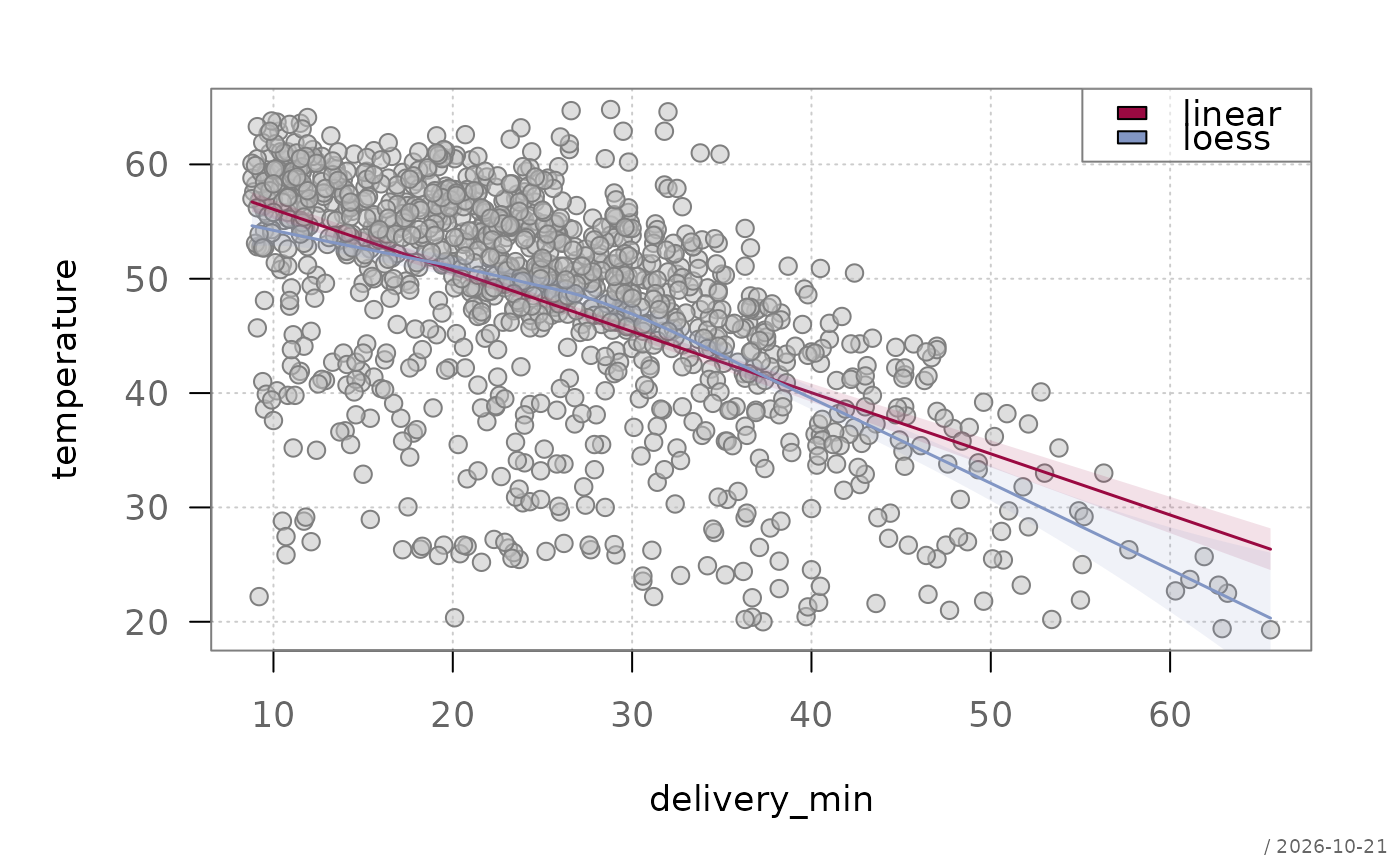
 # No title, compact top margin
plotXY(temperature ~ delivery_min, bedrock::Pizza, main = "")
# No title, compact top margin
plotXY(temperature ~ delivery_min, bedrock::Pizza, main = "")
 # subset, evaluated in data
plotXY(temperature ~ delivery_min, bedrock::Pizza,
subset = area == "Camden")
# subset, evaluated in data
plotXY(temperature ~ delivery_min, bedrock::Pizza,
subset = area == "Camden")