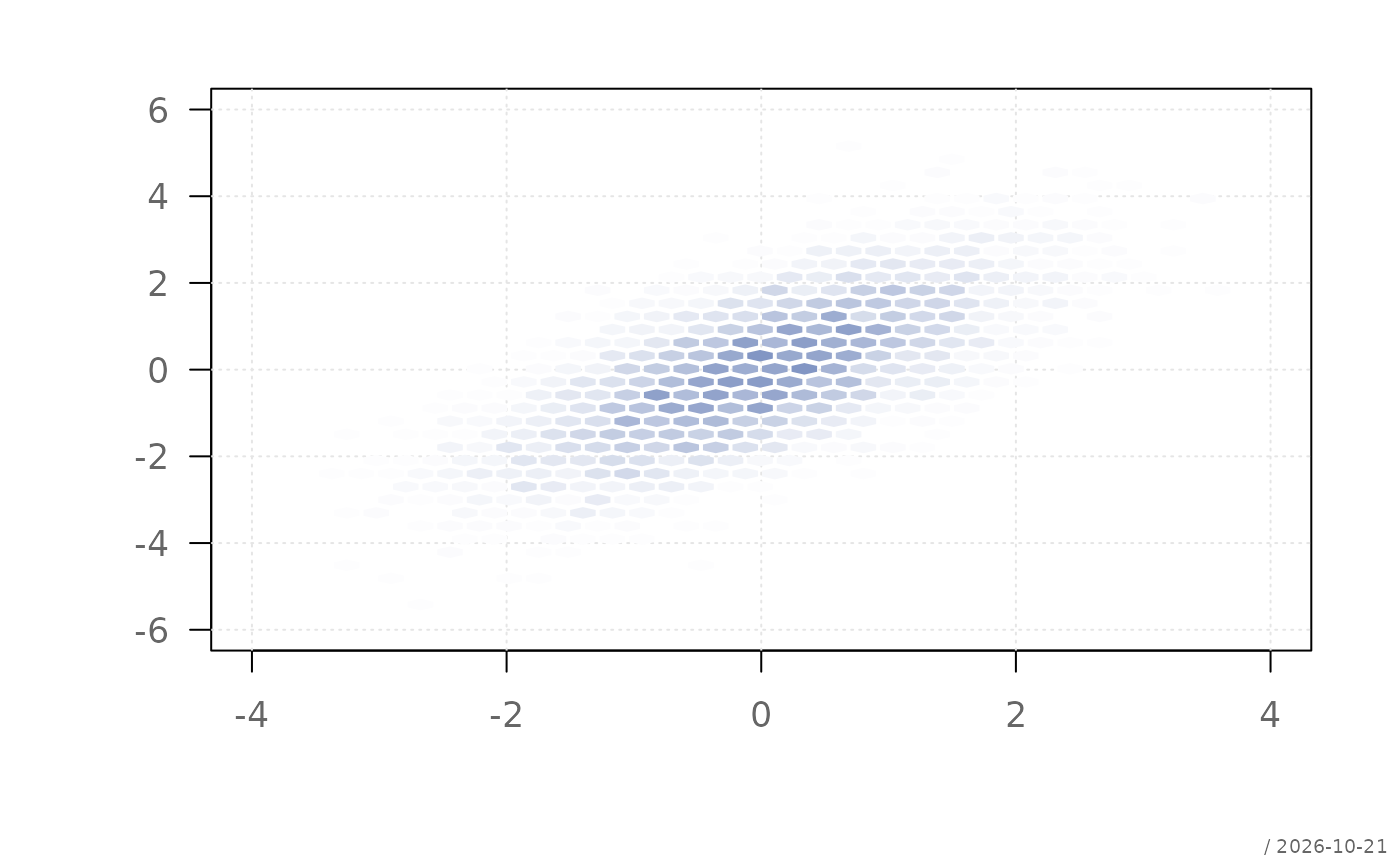
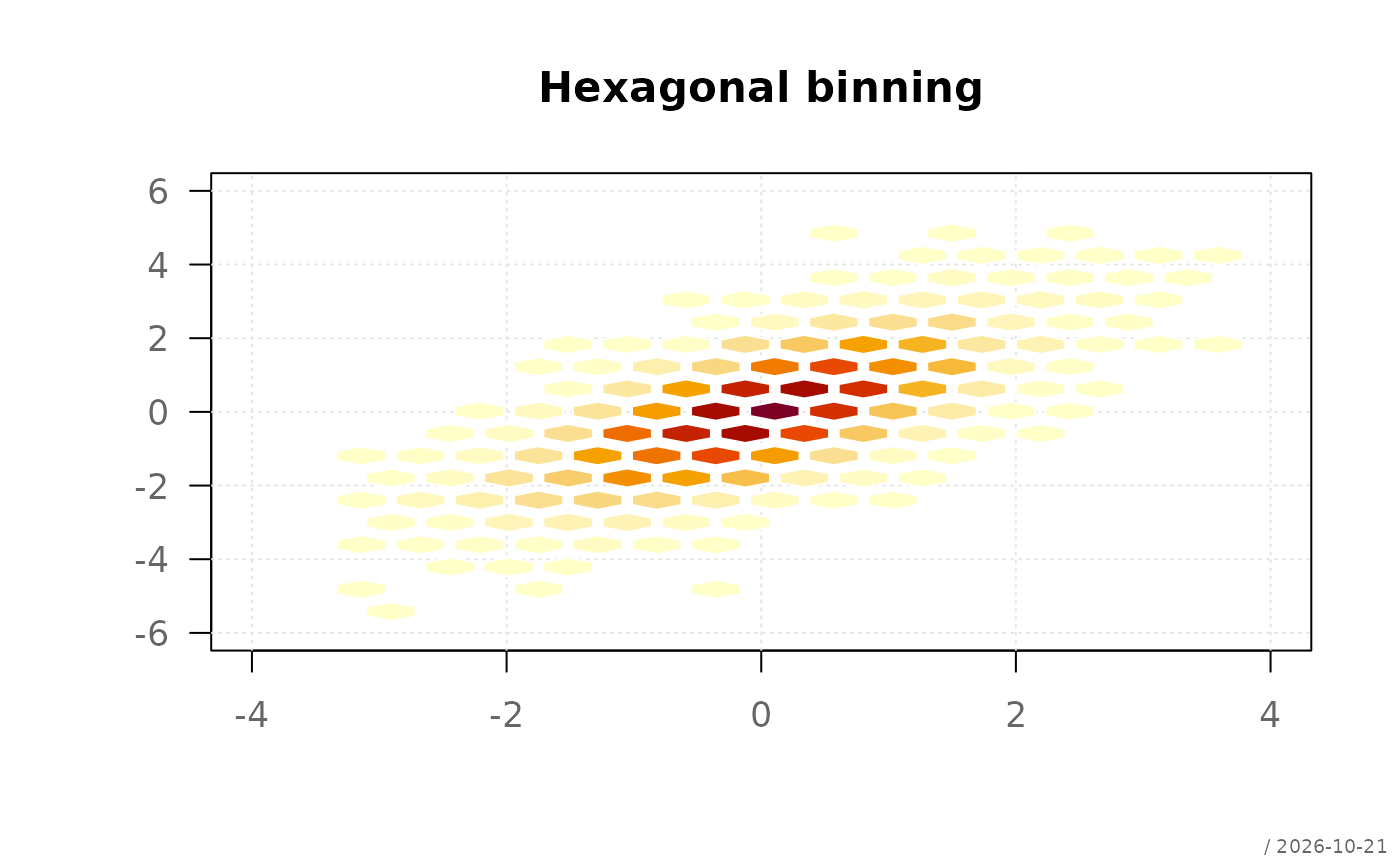
Displays a two-dimensional density estimate using hexagonal bins. Observations are aggregated into hexagons and coloured according to the number of observations falling into each cell.
Usage
plotHexbin(
  x,
  y,
  main = NULL,
  xlab = "",
  ylab = "",
  xlim = NULL,
  ylim = NULL,
  nBins = 30,
  col = NULL,
  border = NA,
  grid = .useTheme,
  stamp = .useTheme,
  ...
)
Arguments
- x
numeric vector of x-values.
- y
numeric vector of y-values.
- main
main title.
- xlab
label for the x-axis.
- ylab
label for the y-axis.
- xlim
limits for the x-axis.
- ylim
limits for the y-axis.
- nBins
number of hexagons across the x-axis.
- col
colours used for the count scale. If
NULL, a default sequential palette is used.- border
border colour of the hexagons.
- grid
controls the background grid.
.useTheme(default) follows the active theme (getTheme()$grid),TRUEdraws it,FALSE,NULLorNAsuppress it, and a named list is passed tographics::grid().- stamp
controls the corner stamp.
.useTheme(default) resolves togetTheme()$stamp.TRUE/FALSE/NULL, a string, or a named list forstamp().- ...
additional graphical parameters passed to
.applyParFromDots().
See also
Other plot.bivariate:
plotAssoc(),
plotBag(),
plotCor(),
plotDens2D(),
plotHeatmap(),
plotMosaic(),
plotXY()
Examples
if (requireNamespace("hexbin", quietly = TRUE)) {

  set.seed(42)
  x <- rnorm(5000)
  y <- x + rnorm(5000)

  plotHexbin(x, y)

  # fewer and larger cells, user-defined colors
  plotHexbin(x, y, nBins = 15,
             col = hcl.colors(50, "YlOrRd", rev = TRUE), border = "white",
             main = "Hexagonal binning")
}