Draws a correlation matrix using graphics::image() with
optional clustering, triangular display, grid lines, color legend,
and numeric labels inside the cells.
Usage
plotCor(
  x,
  main = NULL,
  xlab = NULL,
  ylab = NULL,
  xax = TRUE,
  yax = TRUE,
  minCor = 0,
  cluster = FALSE,
  triangle = c("full", "upper", "lower"),
  diag = TRUE,
  col = .useTheme,
  grid = .useTheme,
  box = .useTheme,
  legend = TRUE,
  text = FALSE,
  stamp = .useTheme,
  ...
)
Arguments
- x
A numeric correlation matrix.
- main, xlab, ylab
optional plot labels.
- xax, yax
controls drawing of the axes.
Supported values are
TRUEdraw axis using default settings
FALSEsuppress axis
list(...)custom axis parameters passed to
graphics::axis()
- minCor
numeric threshold; correlations with absolute value smaller than this are suppressed (set to
NA).- cluster
logical; if
TRUE, variables are reordered by hierarchical clustering to place similar correlations together.- triangle
which part of the matrix to display. One of
"full","upper", or"lower".- diag
logical; should the diagonal be displayed.
- col
color palette used for the correlation values.
.useTheme(default) builds a diverging ramp fromgetTheme()$twin- the active theme's two-color pair - through white:twin[1]at the negative end (\(-1\)), white at zero,twin[2]at the positive end (\(+1\)).- grid
controls drawing of cell-separator grid lines at the half-integer matrix boundaries (clipped to the matrix extent, so they never bleed into the margins). Can be:
.useTheme(default): follow the active theme (getTheme()$grid$col/$lwd)TRUE: draw with theme settingsFALSE,NULL, orNA: suppressa named list: override
col/lwdfor this call only
- box
controls drawing of the plot box.
.useTheme(default) resolves togetTheme()$box.TRUE/FALSE/NA, or a named list, as forgrid.- legend
logical; draw a color legend for the correlation scale.
- text
controls numeric labels drawn inside the matrix cells.
Supported values are
FALSEno labels
TRUEdefault labels based on the correlation values
list(...)custom parameters passed to the internal text drawing routine
- stamp
controls the corner stamp.
.useTheme(default) resolves togetTheme()$stamp.TRUE/FALSE/NULL, a string, or a named list forstamp().- ...
additional graphical parameters passed to
graphics::par()andgraphics::image().
Details
The function follows the DescToolsX plotting conventions:
User arguments override theme settings.
Theme settings override base graphics defaults.
Graphical parameters (e.g.
cex,las,mar) can be supplied via....
The function internally:
Optionally reorders the matrix using hierarchical clustering.
Masks parts of the matrix according to
triangleanddiag.Adjusts plot margins based on label sizes.
Draws the matrix using
graphics::image().Optionally adds grid lines, numeric labels, axes, and a color legend.
Grid lines are drawn via clipped graphics::abline() calls
at the matrix's half-integer cell boundaries rather than via
graphics::grid(): grid()'s nx/ny
divide the full plot region (par("usr")), which may carry axis
padding unrelated to image()'s integer cell geometry, whereas the
clipped approach stays exact regardless of that padding.
See also
graphics::image(), stats::cor(),
theme
Other plot.bivariate:
plotAssoc(),
plotBag(),
plotDens2D(),
plotHeatmap(),
plotHexbin(),
plotMosaic(),
plotXY()
Examples
m <- cor(swiss)
# full correlation matrix
plotCor(m, legend=FALSE)
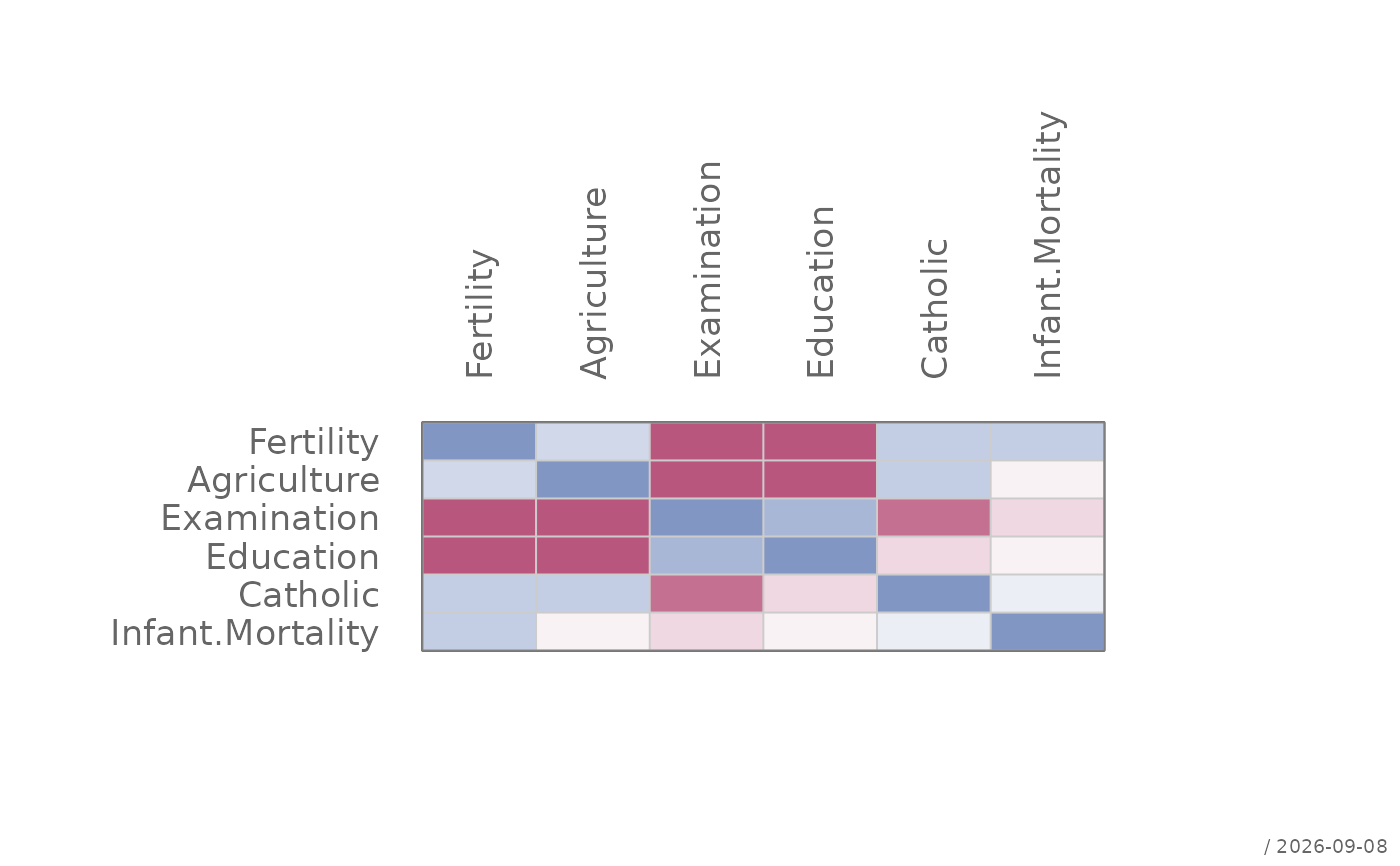 # upper triangle only
plotCor(m, triangle = "upper")
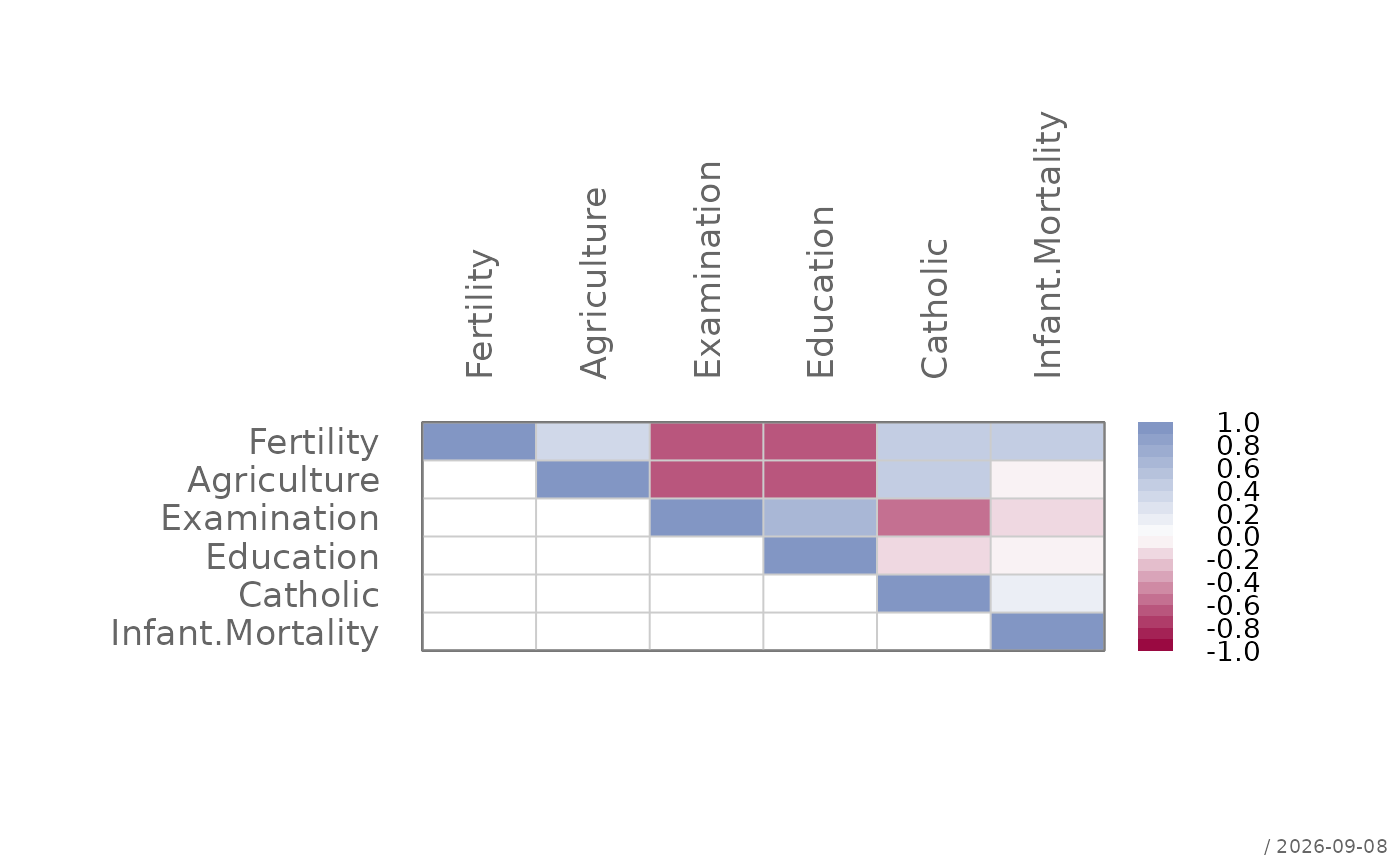
# upper triangle only
plotCor(m, triangle = "upper")
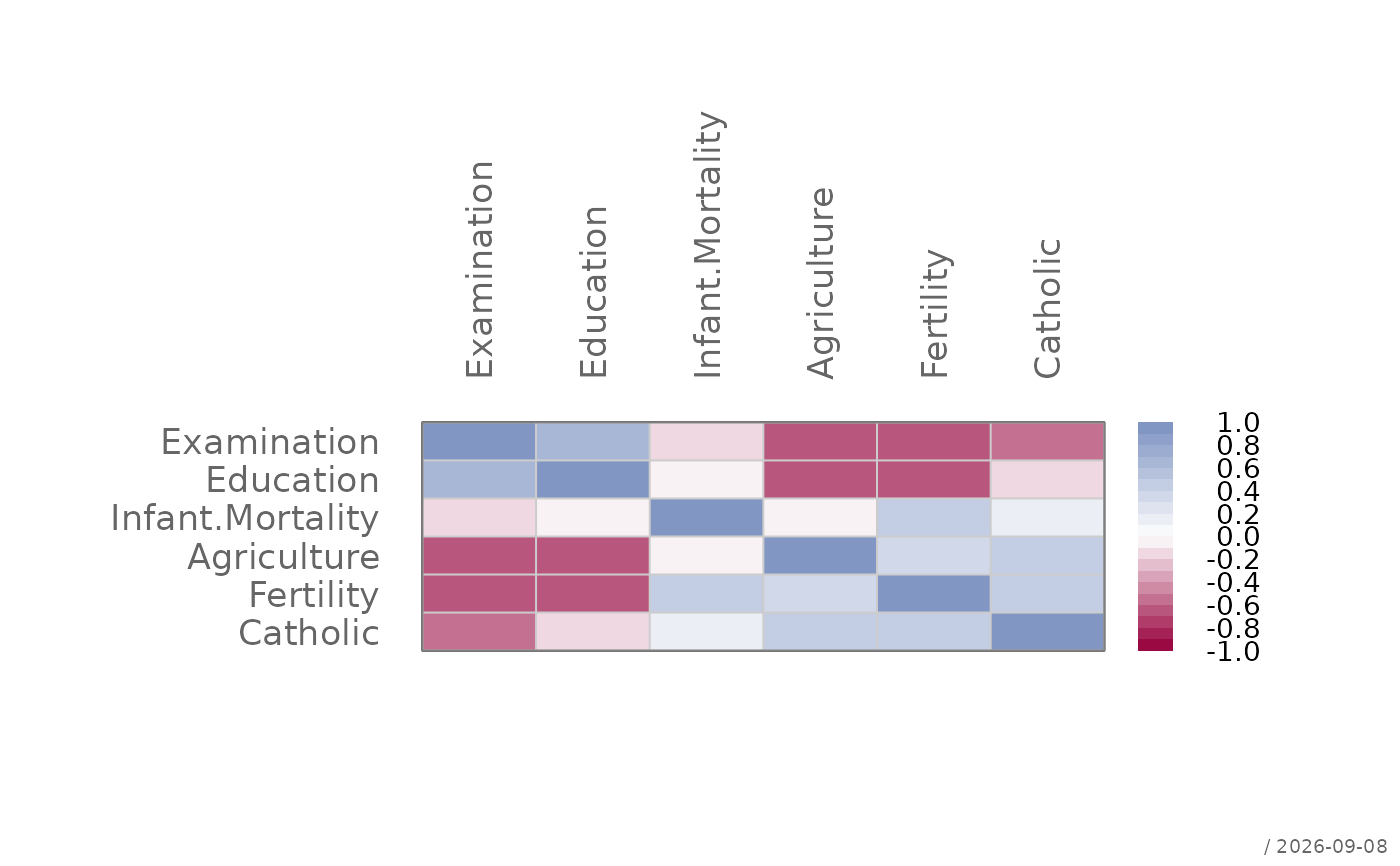
 # clustered variables
plotCor(m, cluster = TRUE)
# clustered variables
plotCor(m, cluster = TRUE)
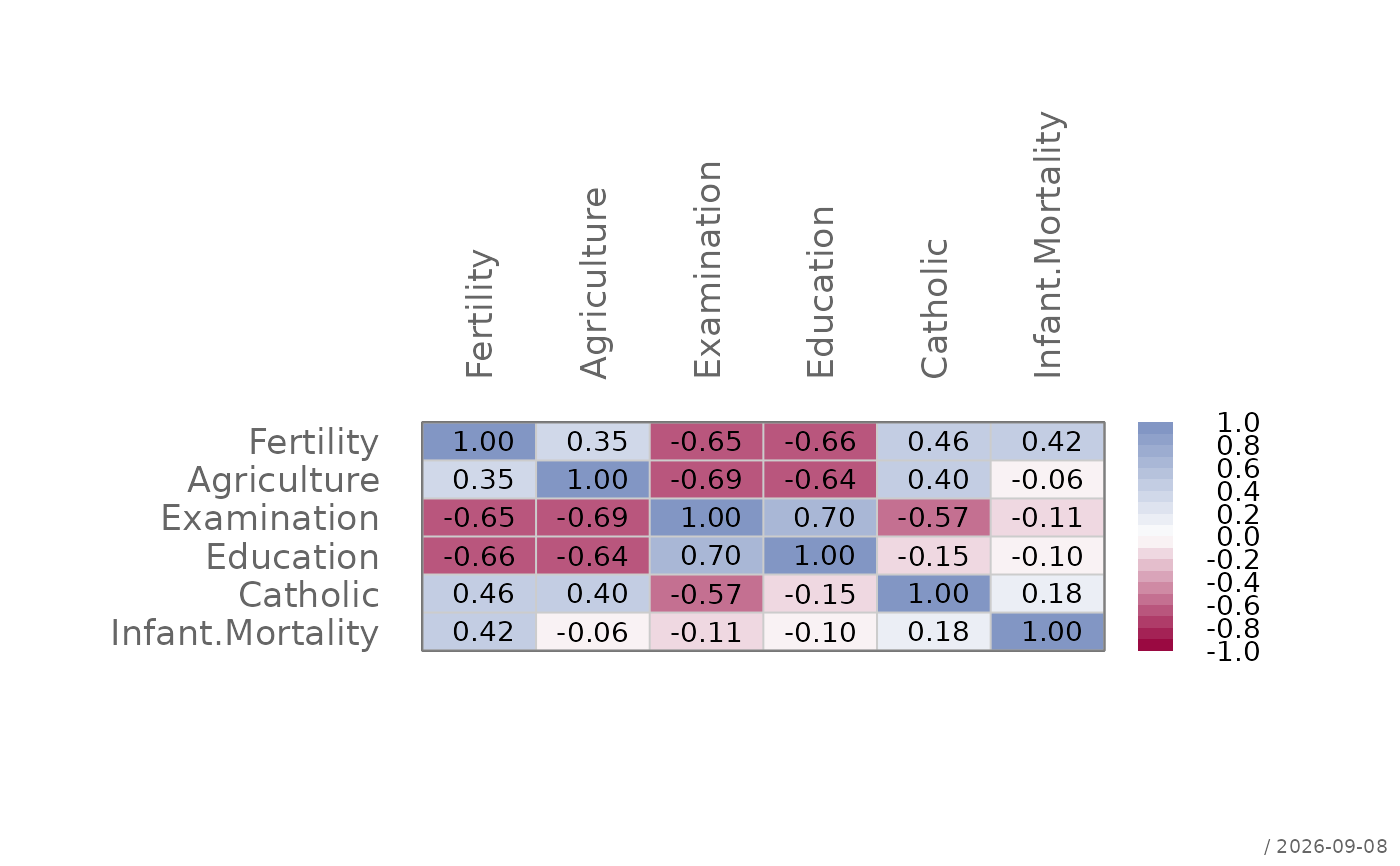
 # with correlation values
plotCor(m, text = TRUE)
# with correlation values
plotCor(m, text = TRUE)
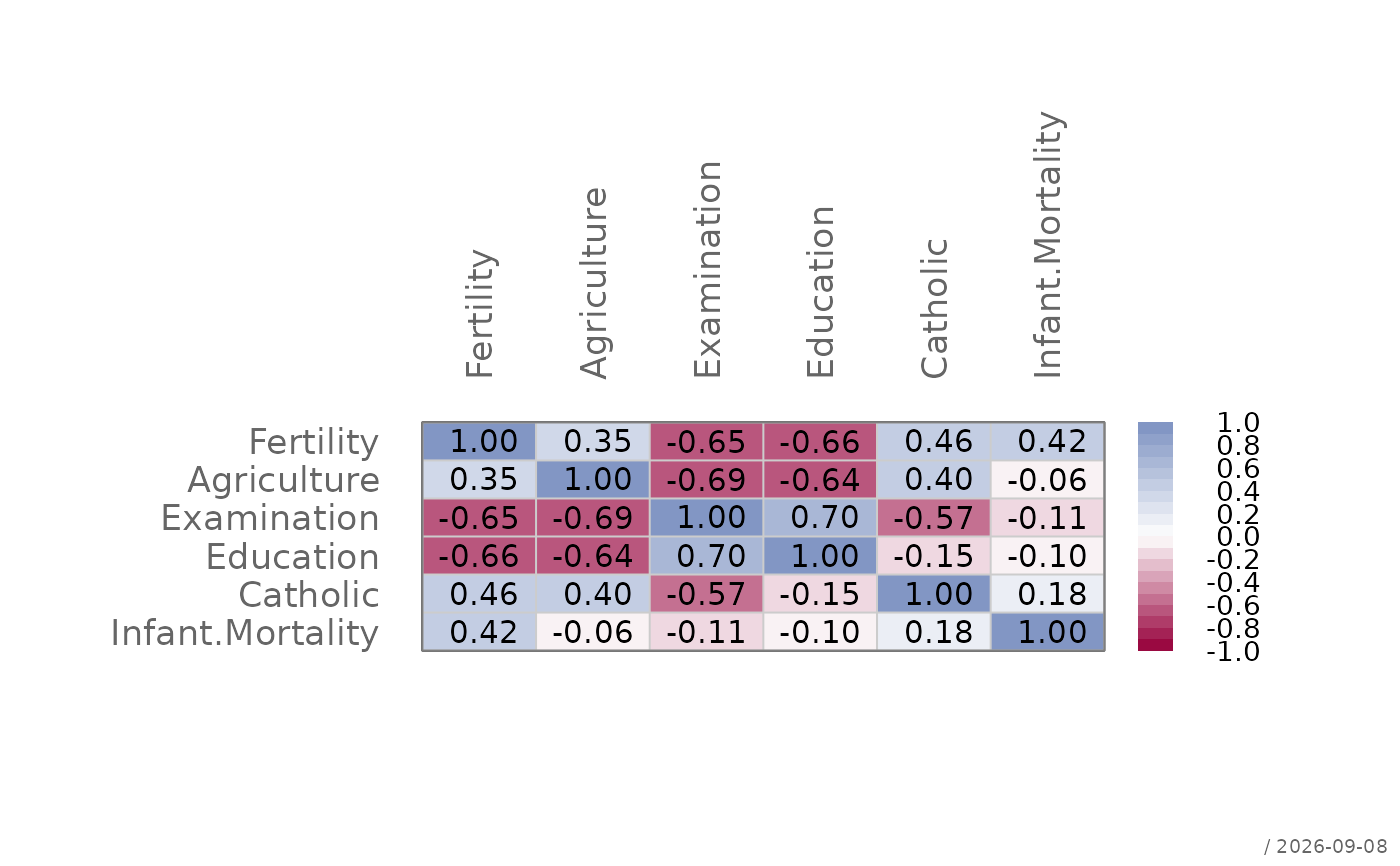
 # customized labels
plotCor(m,
text = list(col = "black", cex = 0.9))
# customized labels
plotCor(m,
text = list(col = "black", cex = 0.9))
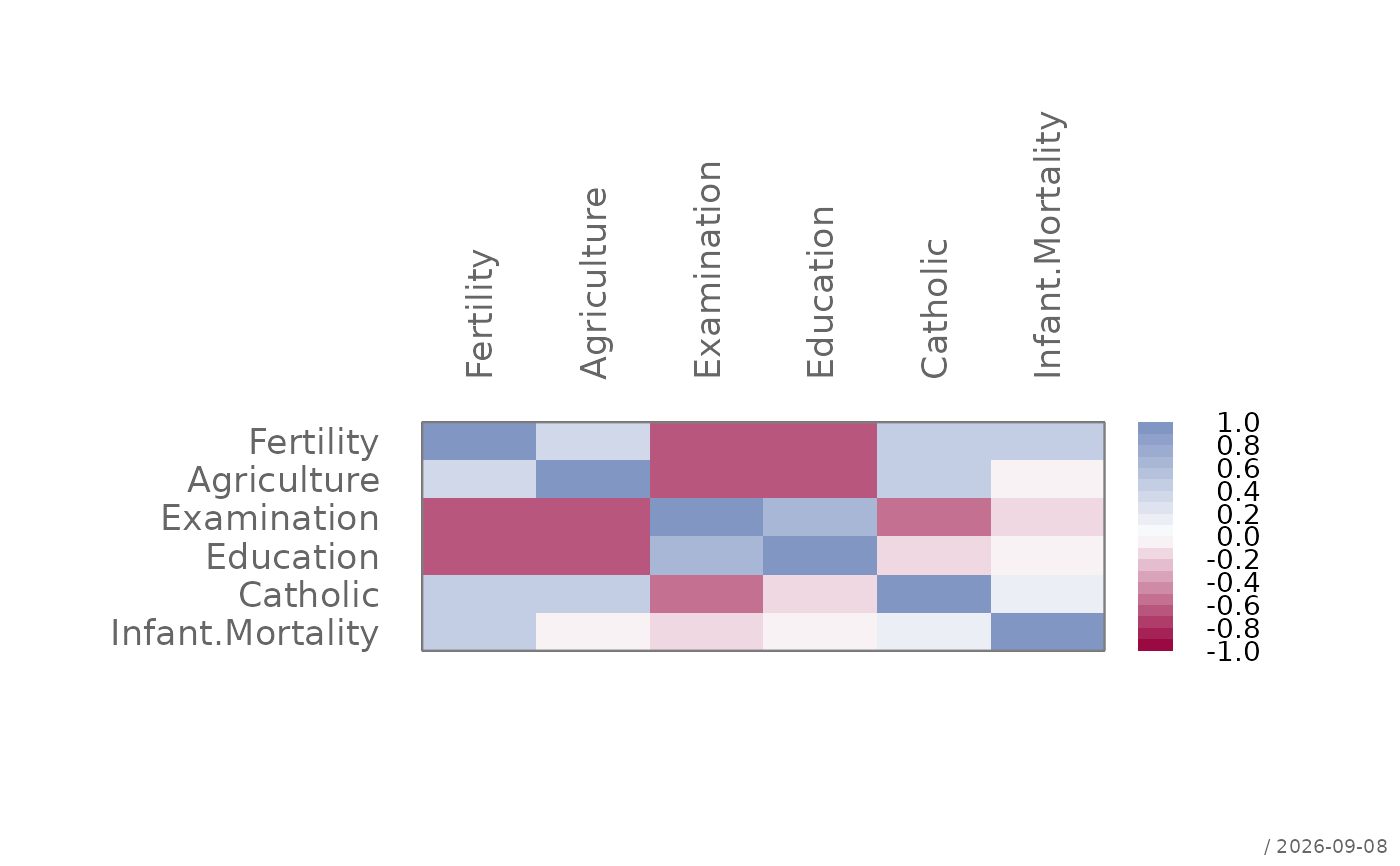
 # hide grid
plotCor(m, grid = FALSE)
# hide grid
plotCor(m, grid = FALSE)
 plotCor(m, col=colorRampPalette(c("red", "black", "green"), space = "rgb")(20))
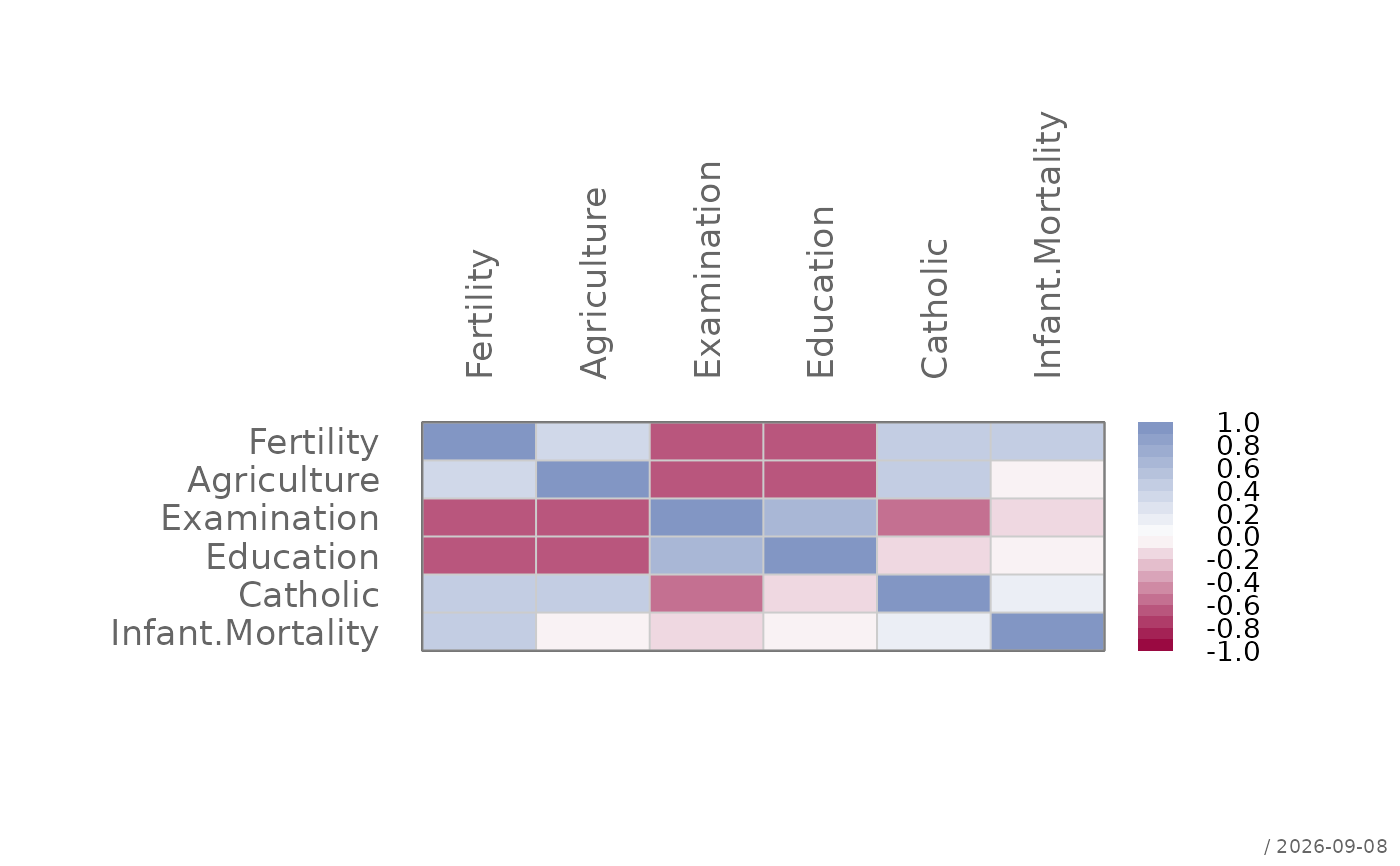 plotCor(m, col=colorRampPalette(c("red", "black", "green"), space = "rgb")(20),
legend=FALSE)
plotCor(m, col=colorRampPalette(c("red", "black", "green"), space = "rgb")(20),
legend=FALSE)
 m <- cor(mtcars)
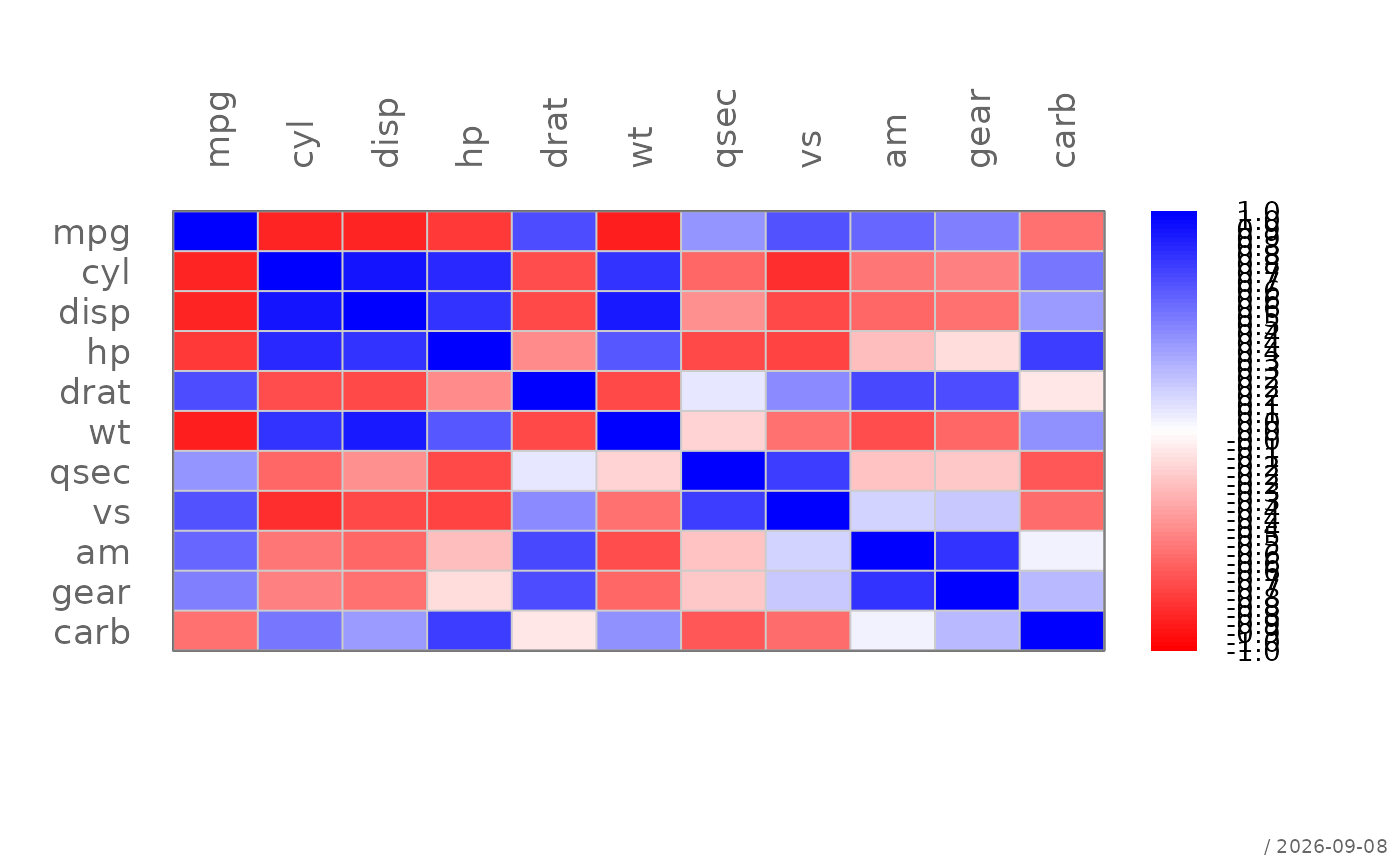
plotCor(m, col=pal("red-white-blue-1", 100), border="grey",
legend=list(labels=format(seq(-1,1,.25), digits=2), box=list(border="grey")))
m <- cor(mtcars)
plotCor(m, col=pal("red-white-blue-1", 100), border="grey",
legend=list(labels=format(seq(-1,1,.25), digits=2), box=list(border="grey")))
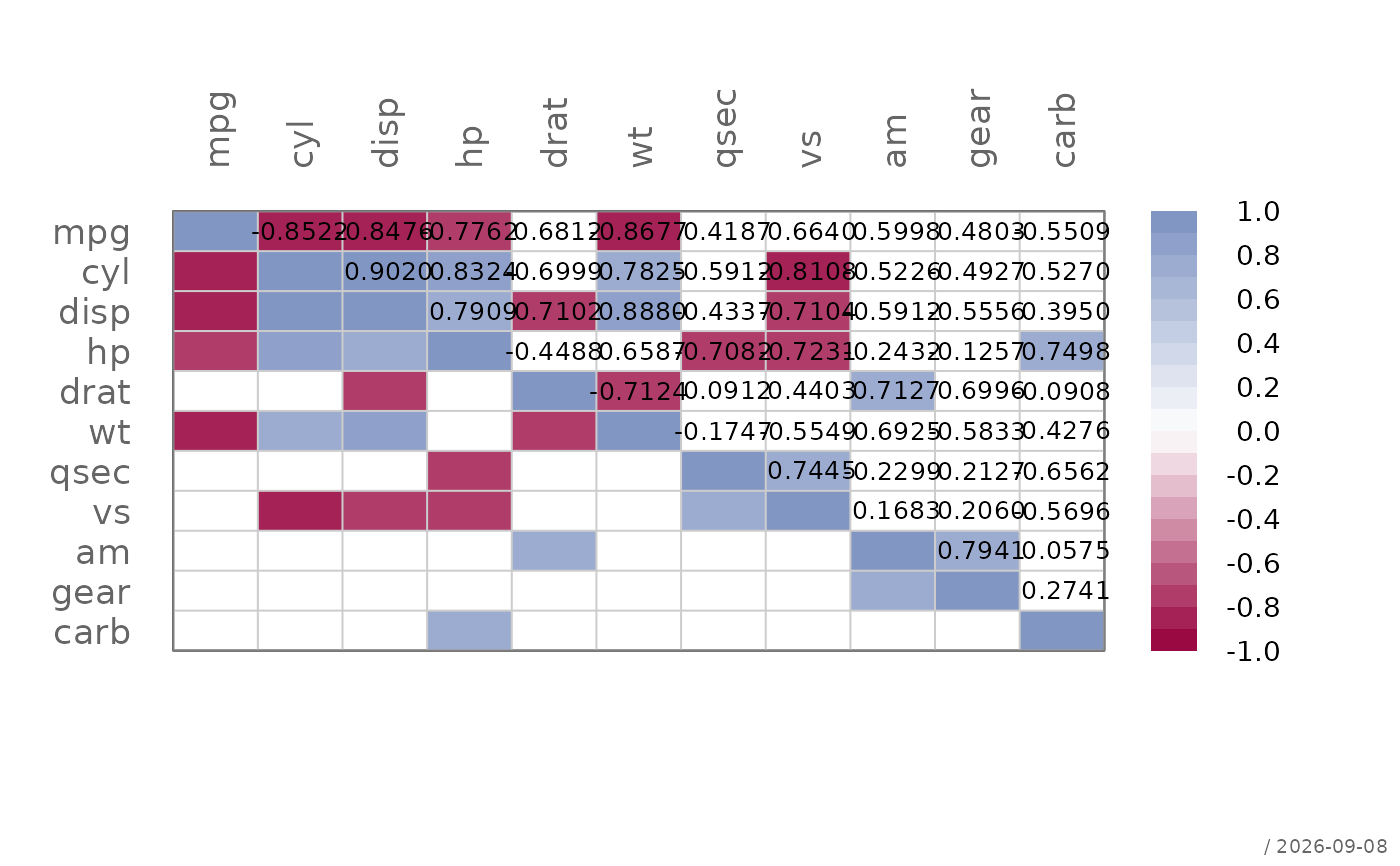 # display only correlation with a value > 0.7
plotCor(m, minCor = 0.7)
x <- matrix(rep(1:ncol(m),each=ncol(m)), ncol=ncol(m))
y <- matrix(rep(ncol(m):1,ncol(m)), ncol=ncol(m))
txt <- format(m, digits=3)
idx <- upper.tri(matrix(x, ncol=ncol(m)), diag=FALSE)
# place the text on the upper triagonal matrix
text(x=x[idx], y=y[idx], label=txt[idx], cex=0.8, xpd=TRUE)
# display only correlation with a value > 0.7
plotCor(m, minCor = 0.7)
x <- matrix(rep(1:ncol(m),each=ncol(m)), ncol=ncol(m))
y <- matrix(rep(ncol(m):1,ncol(m)), ncol=ncol(m))
txt <- format(m, digits=3)
idx <- upper.tri(matrix(x, ncol=ncol(m)), diag=FALSE)
# place the text on the upper triagonal matrix
text(x=x[idx], y=y[idx], label=txt[idx], cex=0.8, xpd=TRUE)
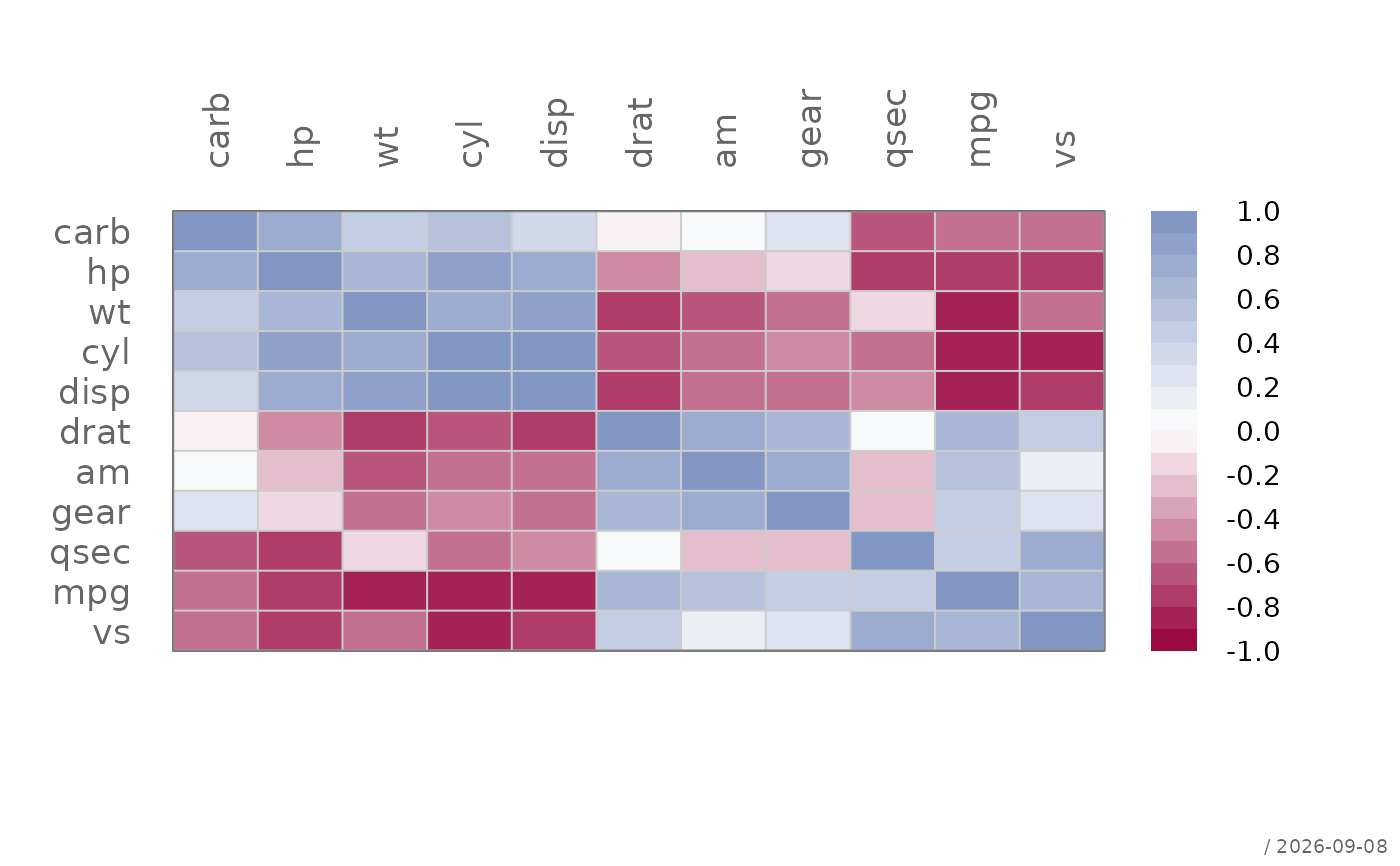 # put similiar correlations together
plotCor(m, cluster=TRUE)
# put similiar correlations together
plotCor(m, cluster=TRUE)
 # same as
idx <- order.dendrogram(as.dendrogram(
hclust(dist(m), method = "mcquitty")
))
plotCor(m[idx, idx])
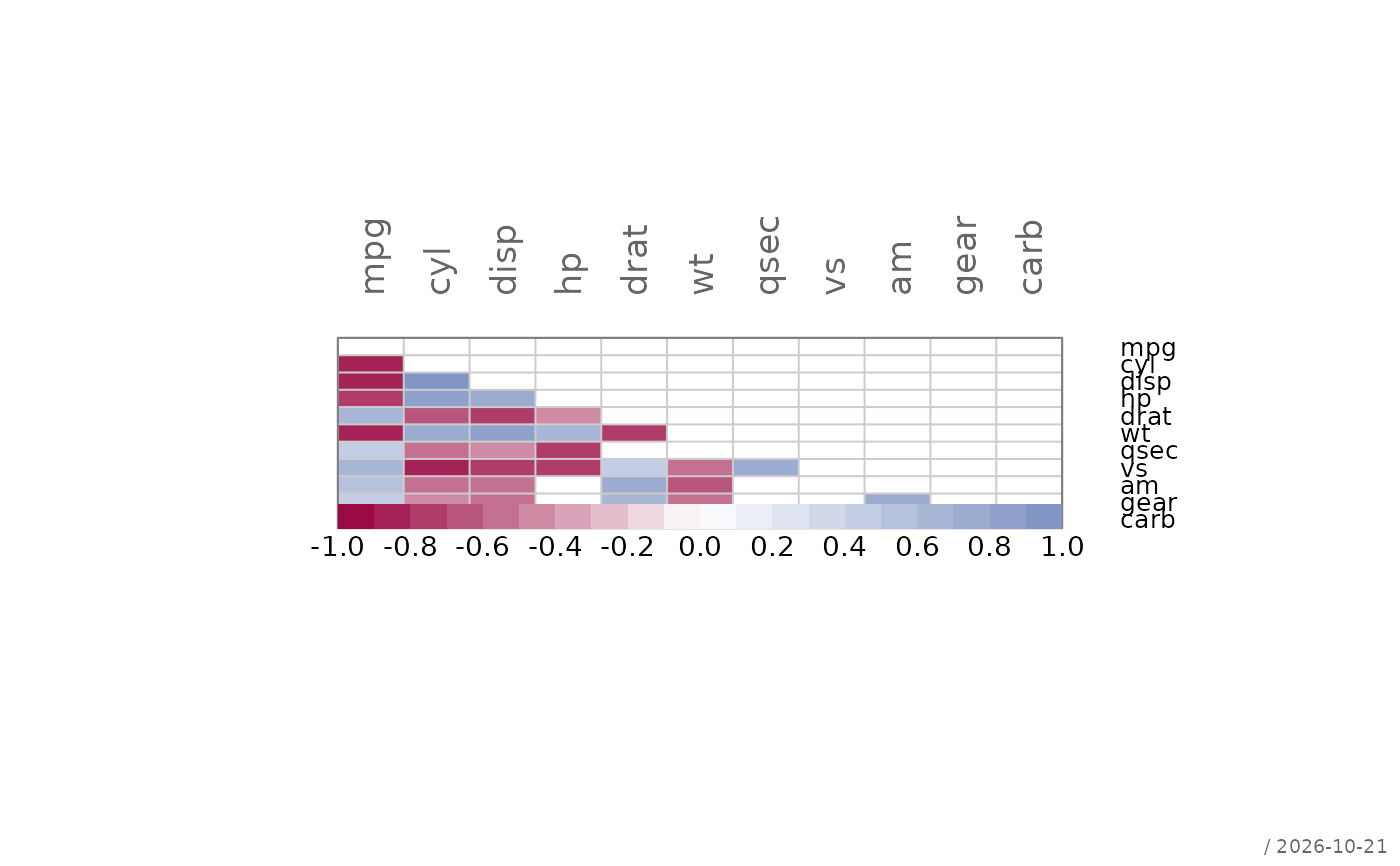
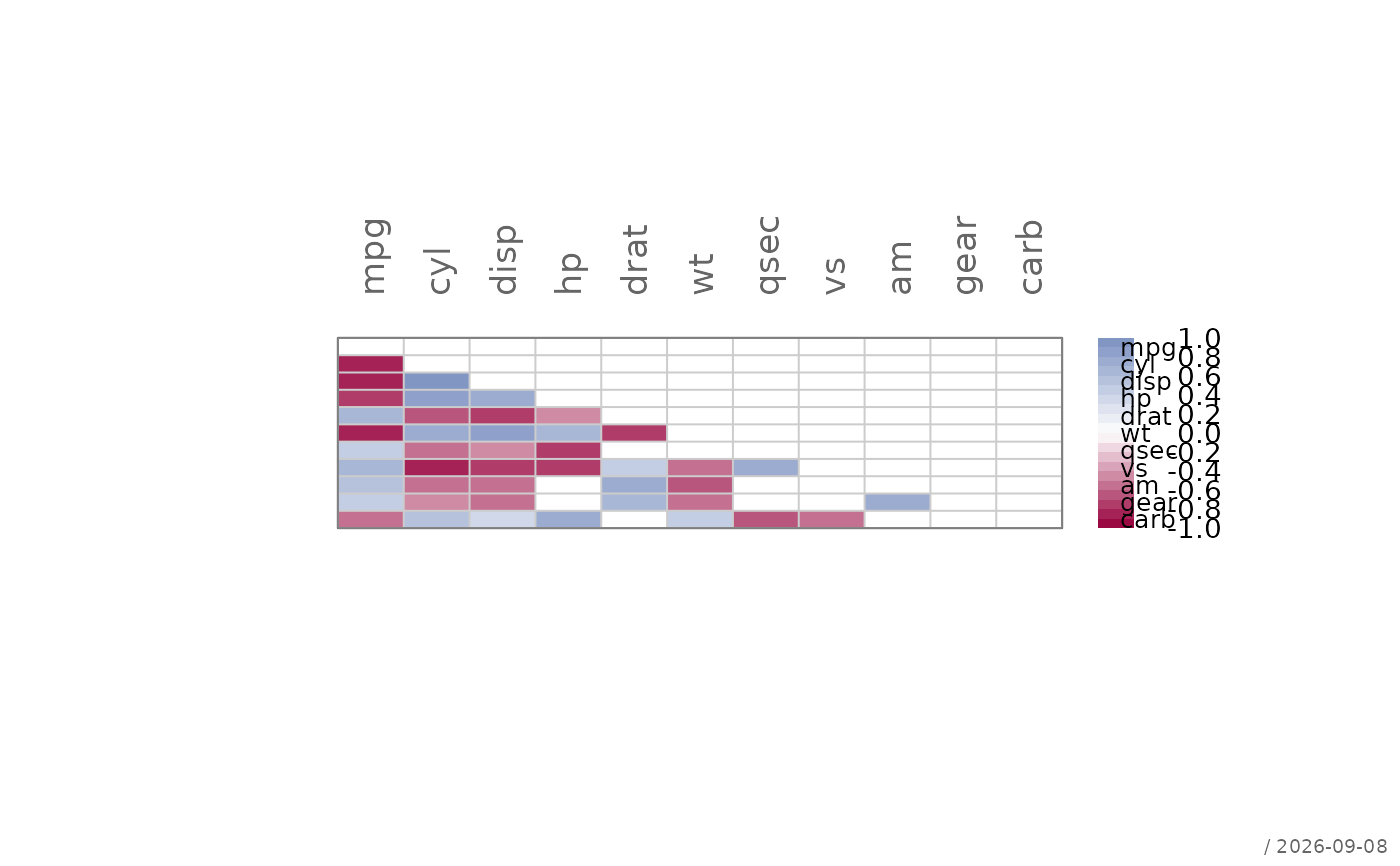
# plot only upper triangular matrix and move legend to bottom
m <- cor(mtcars)
m[lower.tri(m, diag=TRUE)] <- NA
# get the p-values
p <- outer(
(vars <- colnames(mtcars)), vars,
Vectorize(function(v1, v2)
cor.test(mtcars[[v1]], mtcars[[v2]], method = "pearson")$p.value
)
)
dimnames(p) <- list(vars, vars)
m[p > 0.05] <- NA
plotCor(m, mar=c(8,8,8,8), yaxt="n",
legend = list(x="bottom", inset=-.15, horiz=TRUE,
height=abs(lineToUser(line = 2.5, side = 1)),
width=ncol(m)))
mtext(text = rev(rownames(m)), side = 4, at=1:ncol(m), las=1, line = -5, cex=0.8)
# same as
idx <- order.dendrogram(as.dendrogram(
hclust(dist(m), method = "mcquitty")
))
plotCor(m[idx, idx])
# plot only upper triangular matrix and move legend to bottom
m <- cor(mtcars)
m[lower.tri(m, diag=TRUE)] <- NA
# get the p-values
p <- outer(
(vars <- colnames(mtcars)), vars,
Vectorize(function(v1, v2)
cor.test(mtcars[[v1]], mtcars[[v2]], method = "pearson")$p.value
)
)
dimnames(p) <- list(vars, vars)
m[p > 0.05] <- NA
plotCor(m, mar=c(8,8,8,8), yaxt="n",
legend = list(x="bottom", inset=-.15, horiz=TRUE,
height=abs(lineToUser(line = 2.5, side = 1)),
width=ncol(m)))
mtext(text = rev(rownames(m)), side = 4, at=1:ncol(m), las=1, line = -5, cex=0.8)