Compute pretty tickmark locations, the same way as R does internally. By default, gives the at values which axis.POSIXct(side, x) would use.
Arguments
- side
see graphics::axis
- x, at
date-time or date object.
- format
see base::strptime
- labels
either a logical value specifying whether annotations are to be made at the tickmarks, or a vector of character strings to be placed at the tickpoints
- ...
further arguments to be passed from or to other methods
See also
axTicks(), axis.POSIXct()
Other graphics.layout:
abcCoords(),
axisBreak(),
isValidPlotRegion(),
lineToUser(),
mar(),
plotFacet(),
spreadOut()
Examples
with(beaver1, {
  time <- strptime(paste(1990, day, time %/% 100, time %% 100),
                   "%Y %j %H %M")
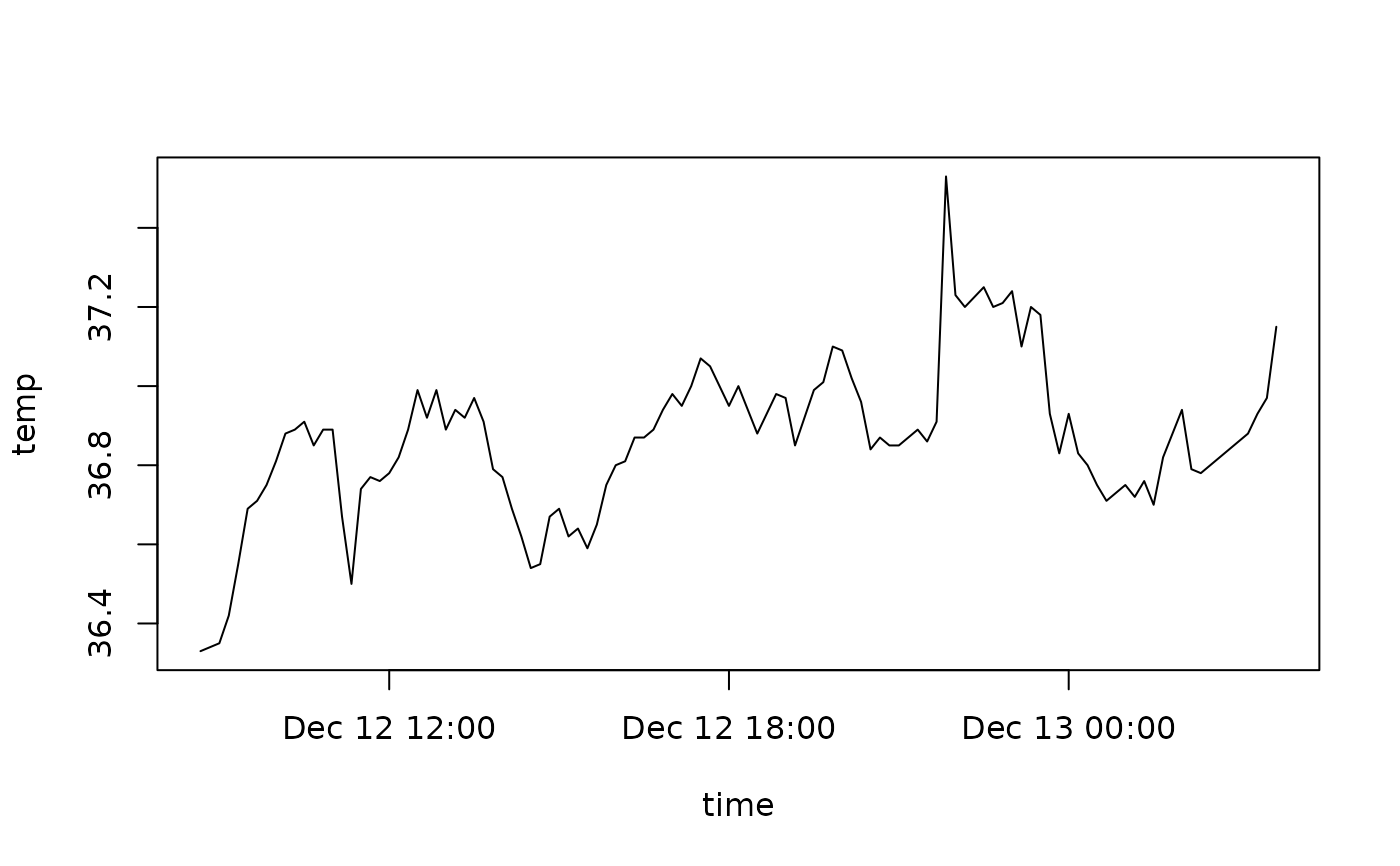
  plot(time, temp, type = "l") # axis at 4-hour intervals.
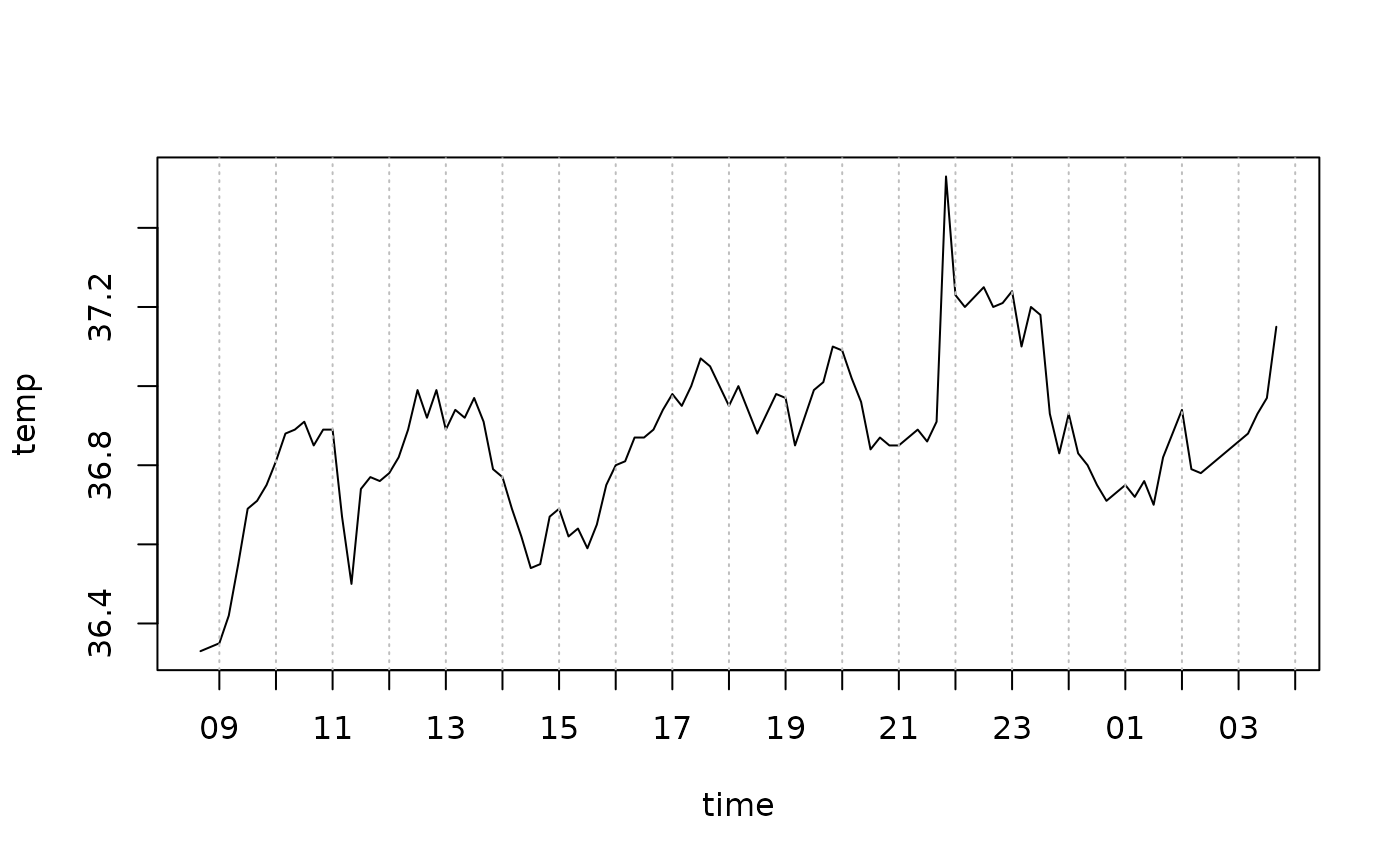
  # now label every hour on the time axis
  plot(time, temp, type = "l", xaxt = "n")
  r <- as.POSIXct(round(range(time), "hours"))
  axis.POSIXct(1, at = seq(r[1], r[2], by = "hour"), format = "%H")
  # place the grid
  abline(v=axTicks.POSIXct(1, at = seq(r[1], r[2], by = "hour"), format = "%H"),
         col="grey", lty="dotted")
})