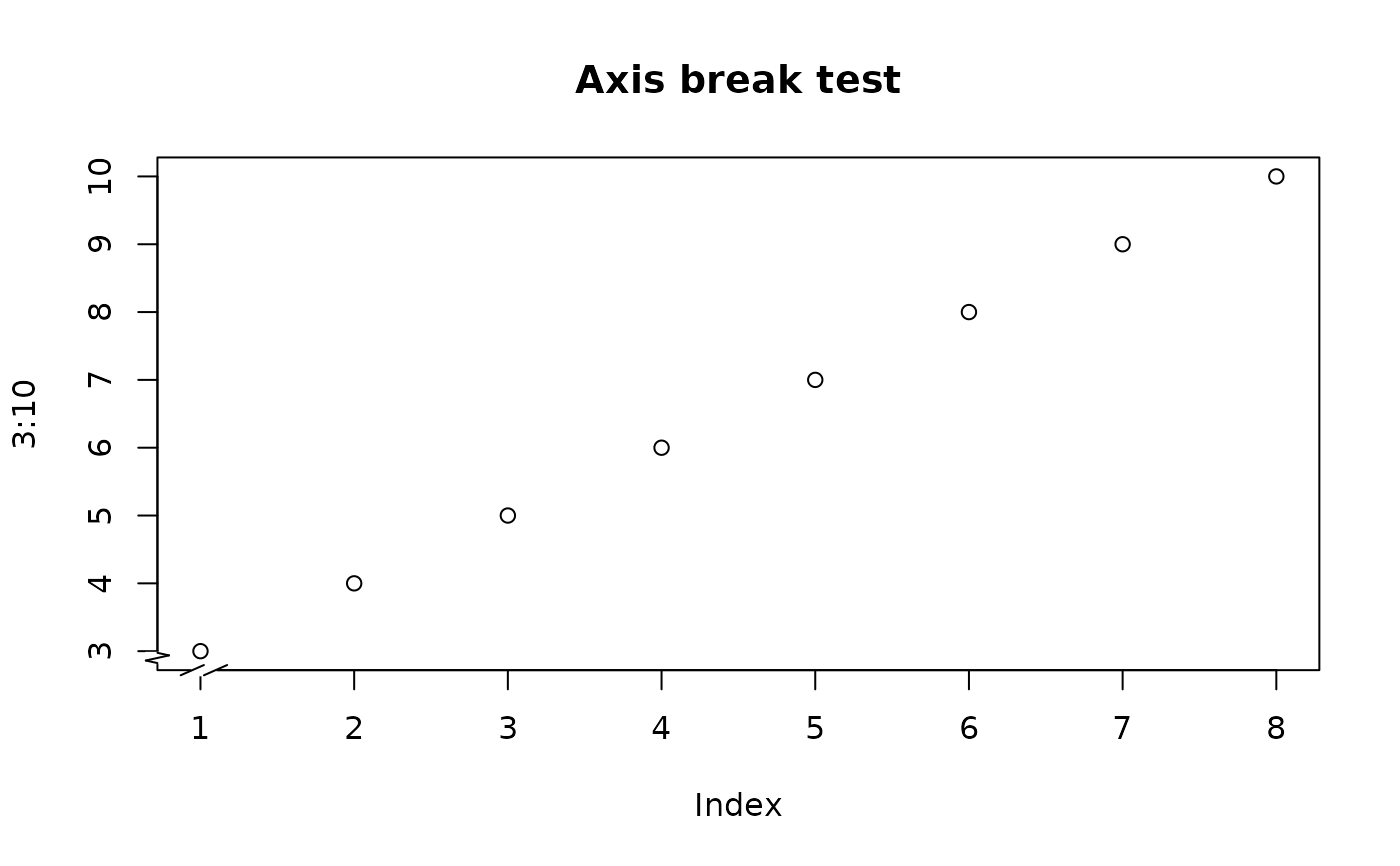
Places a break mark on an axis on an existing plot.
Usage
axisBreak(
  axis = 1,
  breakpos = NULL,
  pos = NA,
  bgcol = "white",
  breakcol = "black",
  style = "slash",
  brw = 0.02
)
Arguments
- axis
which axis to break
- breakpos
where to place the break in user units
- pos
position of the axis (see axis)
- bgcol
the color of the plot background
- breakcol
the color of the "break" marker
- style
either gap, slash or zigzag
- brw
break width relative to plot width
Details
The pos argument is not needed unless the user has specified a different position from the default for the axis to be broken.
Note
There is some controversy about the propriety of using discontinuous
coordinates for plotting, and thus axis breaks. Discontinuous coordinates
allow widely separated groups of values or outliers to appear without
devoting too much of the plot to empty space.
The major objection seems
to be that the reader will be misled by assuming continuous coordinates.
The gap style that clearly separates the two sections of the plot is
probably best for avoiding this.
Based on code by Jim Lemon and Ben Bolker, adapted to conform to package standards
See also
Other graphics.layout:
abcCoords(),
axTicksPosixct(),
isValidPlotRegion(),
lineToUser(),
mar(),
plotFacet(),
spreadOut()
Examples
plot(3:10, main="Axis break test")

# put a break at the default axis and position
axisBreak()
axisBreak(2, 2.9, style="zigzag")