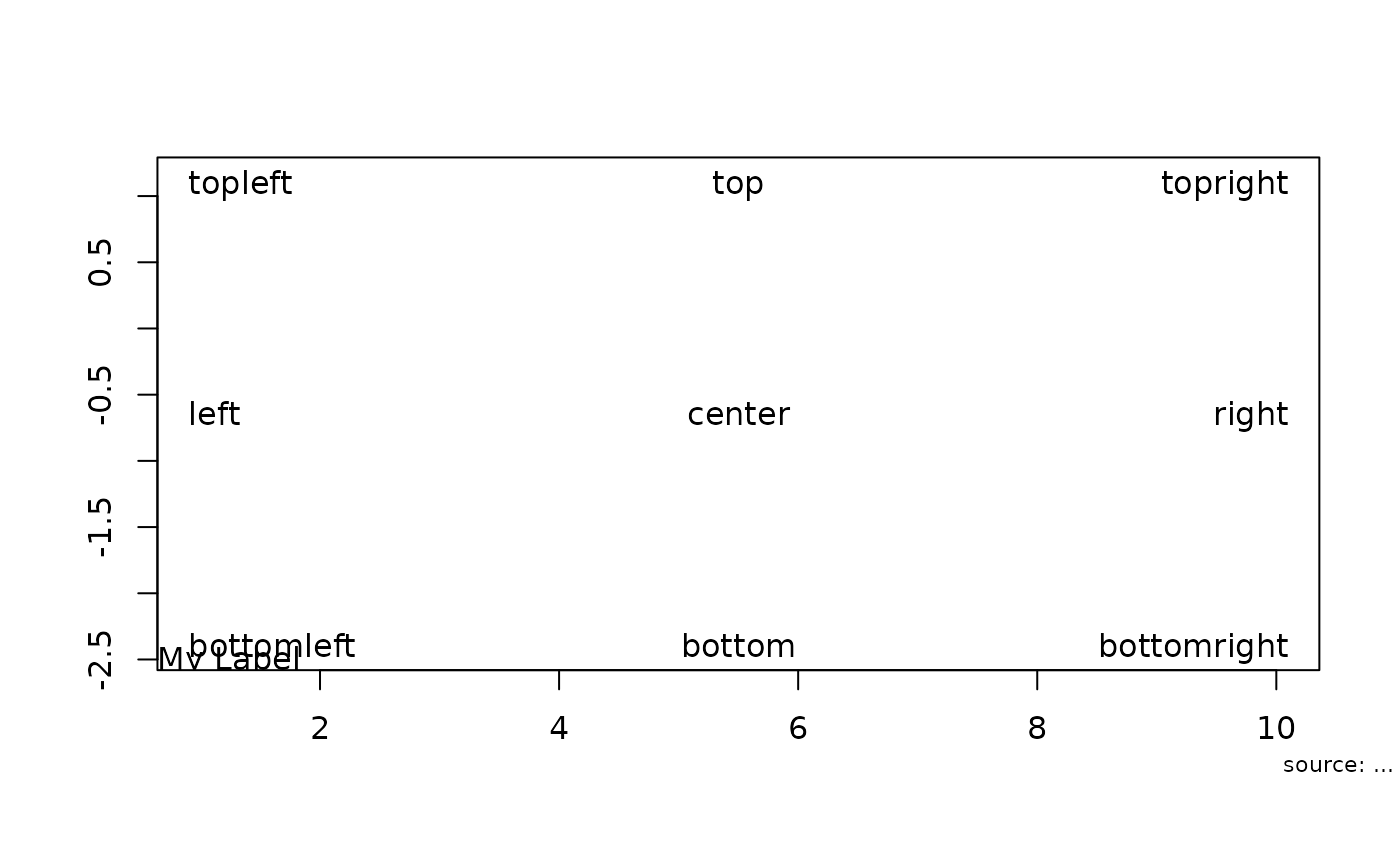
Returns the xy-coordinates and text-adjustment values for named anchor
positions such as "topleft", "center", etc., as used by
legend(). Useful for placing text or other annotations at
consistent, region-aware positions.
Usage
abcCoords(
  x = "topleft",
  region = c("plot", "figure", "device"),
  cex = NULL,
  inset = 0
)
Arguments
- x
A character string specifying the anchor position. One of
"bottomright","bottom","bottomleft","left","topleft","top","topright","right", or"center". Partial matching is supported.- region
one of
"plot"(default),"figure", or"device". Determines the coordinate region used. See Details for the clipping that comes with the latter two.- cex
character expansion factor. If
NULL(default), the currentpar("cex")is used.- inset
inset distance from the boundary, specified in lines of text (character heights/widths). May be a scalar (applied to both x and y) or a length-2 vector (x inset, y inset). Default
0.
Value
A list with two components:
xyA list with elements
xandygiving the anchor coordinates in user space.adjA numeric vector of length 2, suitable for the
adjargument oftext().
Details
The positioning logic is adapted from legend().
The inset is computed in character units via strwidth() and
strheight(), making it robust to device resizing, font
changes, and plot-range scaling.
Three regions are supported:
"plot"The inner plot area (
par("usr")). The default, and the regionlegend()positions in."figure"The figure region within the device, accounting for
par("fig")."device"The full device area.
Coordinates for "figure" and "device" lie outside
par("usr") and are therefore clipped away by text()
and friends unless the drawing call sets xpd = NA. The returned
values are in user space either way; only the clipping has to be turned
off by the caller.
See also
Other graphics.layout:
axTicksPosixct(),
axisBreak(),
isValidPlotRegion(),
lineToUser(),
mar(),
plotFacet(),
spreadOut()
Examples
plot(x = rnorm(10), type = "n", xlab = "", ylab = "")

# coordinates only
abcCoords("bottomleft")
#> $xy
#> $xy$x
#> [1] 0.64
#>
#> $xy$y
#> [1] -2.580691
#>
#>
#> $adj
#> [1] 0 0
#>

# place text at a named position
xy <- abcCoords("bottomleft")
text(x = xy$xy$x, y = xy$xy$y, labels = "My Label", adj = xy$adj)

# all nine positions with inset
sapply(c("topleft", "top", "topright",
         "left",    "center", "right",
         "bottomleft", "bottom", "bottomright"),
  function(p) {
    xy <- abcCoords(p, inset = 1)
    text(x = xy$xy$x, y = xy$xy$y,
         labels = p, adj = xy$adj)
  })
#> $topleft
#> NULL
#>
#> $top
#> NULL
#>
#> $topright
#> NULL
#>
#> $left
#> NULL
#>
#> $center
#> NULL
#>
#> $right
#> NULL
#>
#> $bottomleft
#> NULL
#>
#> $bottom
#> NULL
#>
#> $bottomright
#> NULL
#>

# the margins need xpd = NA, whatever the coordinates say
xy <- abcCoords("bottomright", region = "figure", inset = 0.5)
text(x = xy$xy$x, y = xy$xy$y, labels = "source: ...",
     adj = xy$adj, cex = 0.7, xpd = NA)