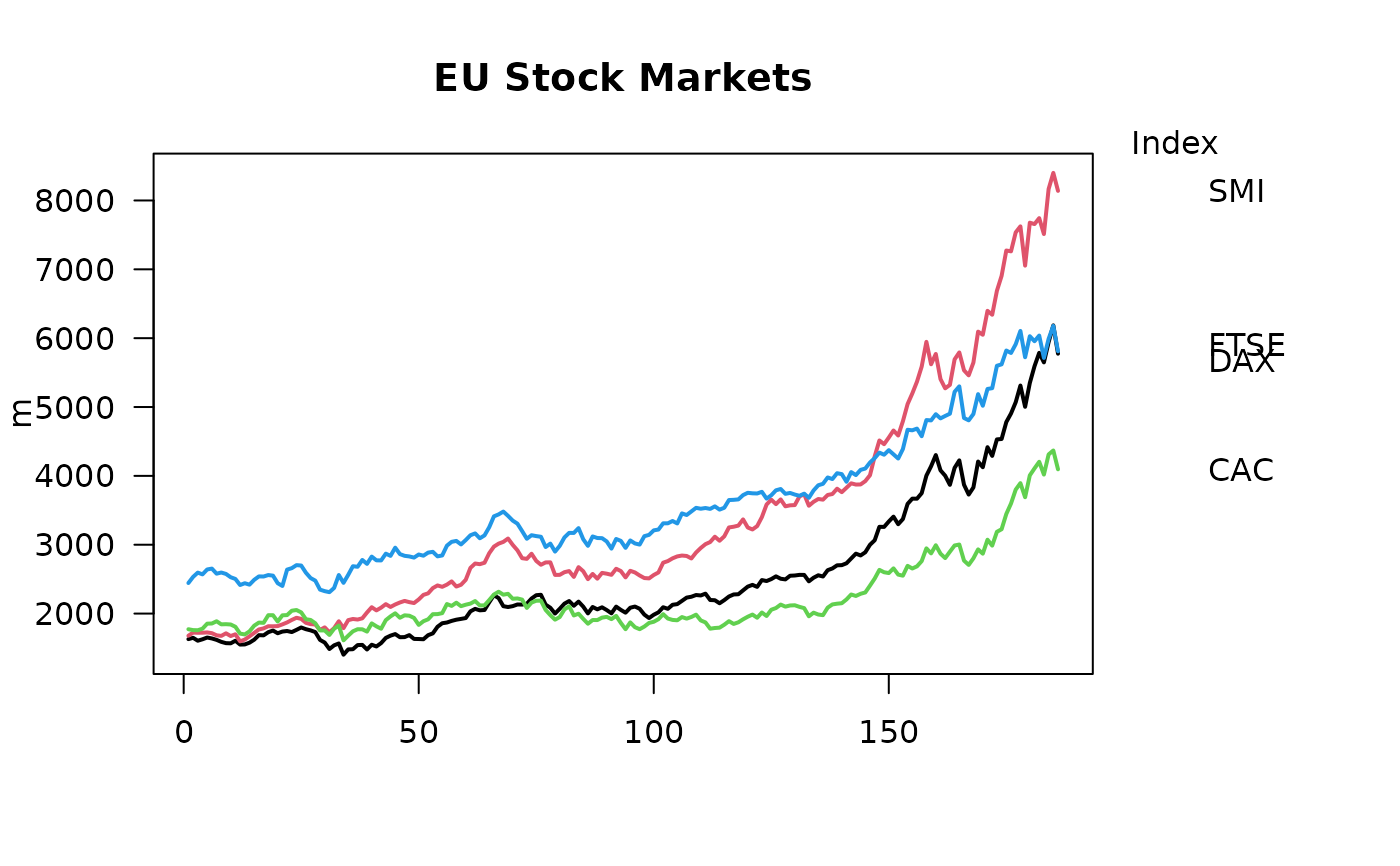
Draw a legend in the right margin consisting of short line segments
and text labels, placed next to the (typically last) values of the
plotted series. This labels lines directly instead of using a boxed
legend(), as commonly preferred for time series and
profile plots.
Arguments
- y
numeric vector with the vertical anchor positions in user coordinates, typically the last observed value of each series, in series (column) order. Sorting and collision handling are done internally.
- labels
character vector of labels, parallel to
y. Defaults tonames(y), or the series index ifyis unnamed.- line
numeric vector of length 1 or 2 (recycled), in margin lines of side 4. The first element is the offset of the segments from the plot region, the second the gap between segments and labels.
- width
length of the line segments in margin lines. Set to
NAto suppress the segments; the labels are then placed directly atline[1].- col, lty, lwd
color, line type and width of the segments, parallel to
y(in series order, recycled). Ignored ifwidthisNA.- cex
character expansion for the labels. Also enters the default vertical spacing, so larger text automatically gets wider spacing.
- main
optional title for the legend, drawn at the top of the plot region. Default is
NULL(none).- minDist
minimal vertical distance between labels in user coordinates, passed to
spreadOut(). Default is1.2 * strheight("M") * cex.
Value
The (sorted and spread) vertical label positions, invisibly. Useful for adding further annotation next to the labels.
Details
The function owns the legend geometry: the anchor positions y
are sorted internally so the legend follows the vertical order of the
lines, the graphical parameters are recycled accordingly, and vertical
label collisions are resolved via spreadOut(). Callers therefore
simply pass the values in series order, parallel to col,
lty and lwd.
Drawing uses mtext() and segments() in the
device margin; xpd is set to TRUE and restored on exit.
Horizontal positions are given in margin lines of side 4 and converted
to user coordinates via lineToUser().
Make sure the right margin is wide enough for segments and
labels, e.g. via the mar argument of the calling plot
function.
See also
plotLines(), mtext(),
segments(), legend()
Other graphics.annotation:
barText(),
boxedText(),
colLegend(),
errBars(),
stamp(),
titleRect()