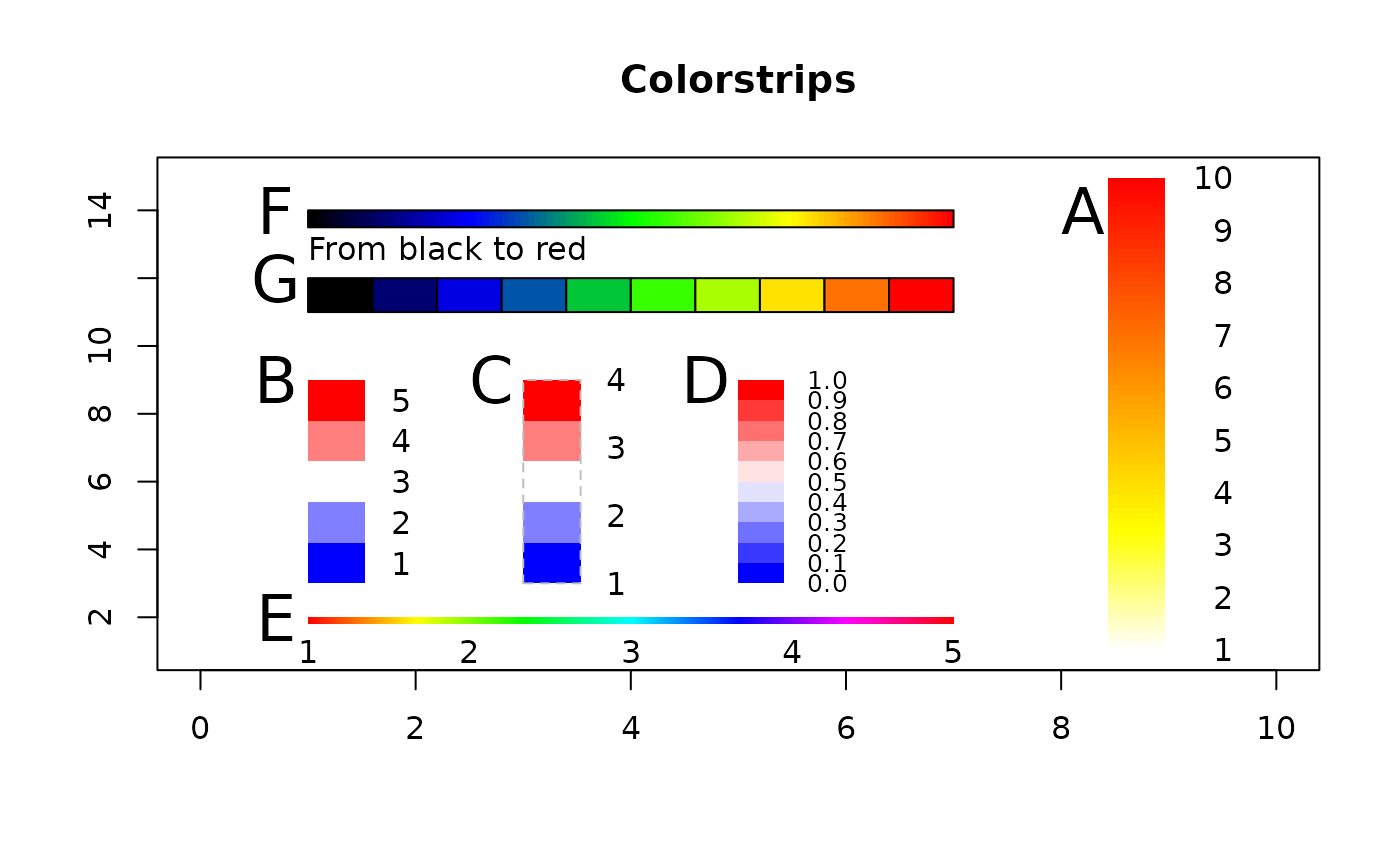
Draw a color legend (color strip) inside an existing plot region.
Usage
colLegend(
  x,
  y = NULL,
  col = rev(heat.colors(100)),
  labels = NULL,
  title = NULL,
  width = NULL,
  height = NULL,
  horiz = FALSE,
  xjust = 0,
  yjust = 1,
  inset = 0,
  region = c("plot", "figure", "device"),
  border = NA,
  box = FALSE,
  adj = NULL,
  cex = 1,
  ...
)
Arguments
- x
left x-coordinate of the legend or a keyword specifying automatic placement:
"bottomright","bottom","bottomleft","left","topleft","top","topright","right","center".- y
top y-coordinate of the legend when
xis numeric.- col
vector of colors.
- labels
optional vector of labels, or a list holding the labels (element
text, or the one unnamed element) and their placement relative to the color blocks in the elementadj:"edge"(default) Labels are aligned with the strip edges.
"center"Labels are centered within color blocks.
E.g.
labels = list(1:5, adj = "center").- title
optional title, or a list holding the title (element
text, or the one unnamed element) and its horizontal adjustment in the elementadj(default 0.5, centered), e.g.title = list("From black to red", adj = 0).- width
width of the legend in user coordinates.
- height
height of the legend in user coordinates.
- horiz
logical; if
TRUE, draw horizontally.- xjust
horizontal justification.
- yjust
vertical justification.
- inset
inset distance(s) when keyword positioning is used.
- region
character string specifying the reference region used for keyword placement. One of:
"plot","figure", or"device".- border
border color of individual color rectangles.
- box
optional specification of an enclosing box around the whole legend. Can be:
FALSE,NULL, orNA: no boxTRUE: draw box with defaultsnamed list of arguments passed to
rect()
- adj
text alignment passed to
text().- cex
character expansion for labels.
- ...
additional arguments passed to
text().
Value
Invisibly returns a list with components:
- rect
List describing the color strip geometry with components
width,height,left, andtop.- text
List containing the label coordinates
xandy.
Details
The legend can be positioned either by explicit coordinates or by
keyword placement such as "topright" or "left".
Labels may either be aligned with the edges of the color strip or centered within the color blocks.
See also
Other graphics.annotation:
barText(),
boxedText(),
errBars(),
stamp(),
textLegend(),
titleRect()
Examples
plot(1:15,, xlim=c(0,10), type="n", xlab="", ylab="", main="Colorstrips")

# A
colLegend(x="right", inset=5, labels=c(1:10))

# B: Center the labels
colLegend(x=1, y=9, height=6, col=colorRampPalette(c("blue", "white", "red"),
  space = "rgb")(5), labels=list(1:5, adj = "center"))

# C: Outer frame
colLegend(x=3, y=9, height=6, col=colorRampPalette(c("blue", "white", "red"),
  space = "rgb")(5), labels=1:4, box=list(border="grey", lty="dashed"))

# D
colLegend(x=5, y=9, height=6, col=colorRampPalette(c("blue", "white", "red"),
  space = "rgb")(10), labels=sprintf("%.1f",seq(0,1,0.1)), cex=0.8)

# E: horizontal shape
colLegend(x=1, y=2, width=6, height=0.2, col=rainbow(500), labels=1:5,horiz=TRUE)

# F
colLegend(x=1, y=14, width=6, height=0.5, col=colorRampPalette(
  c("black","blue","green","yellow","red"), space = "rgb")(100),
  horiz=TRUE, box = TRUE)

# G
colLegend(x=1, y=12, width=6, height=1, col=colorRampPalette(c("black","blue",
            "green","yellow","red"), space = "rgb")(10), horiz=TRUE,
            border="black", title=list("From black to red", adj=0))

text(x = c(8,0.5,2.5,4.5,0.5,0.5,0.5)+.2, y=c(14,9,9,9,2,14,12), LETTERS[1:7], cex=2)