Describe a Variable by a Factor with Two Levels
TwoGroups.RdThis function describes a numeric variable by a grouping factor with two levels. First, a descriptive text listing the frequencies and means of the two groups and the results of the significance test is generated. The results of Desc(x~g) are reported as they are provided by the function, followed by a plot consisting of a density plot and a box plot.
This description makes sense, for example, if the age distribution of a collective is to be represented for both sexes.
TwoGroups(x, ..., plotit = TRUE)

# Default S3 method
TwoGroups(x, g, main = NULL, vname = NULL, ..., plotit = TRUE)

# S3 method for class 'formula'
TwoGroups(formula, data, subset, na.action, ...)

# S3 method for class 'TwoGroups'
ToWrd(x, font = NULL, ..., wrd = DescToolsOptions("lastWord"))
Arguments
- x
the numeric variable to describe.
- g
the grouping factor (preferably with two levels.)
- main
the main title.
- vname
the variable names used in the description text.
- plotit
boolean. Should a plot be created? Default can be defined by
DescToolsOptions(plotit=TRUE/FALSE), if it does not exist then it's set toFALSE.- formula
a formula of the form
lhs ~ rhswherelhsgives the data values and rhs the corresponding groups.- data
an optional matrix or data frame (or similar: see
model.frame) containing the variables in the formulaformula. By default the variables are taken fromenvironment(formula).- subset
an optional vector specifying a subset of observations to be used.
- na.action
a function which indicates what should happen when the data contain NAs. Defaults to
getOption("na.action").- font
the first font will be chosen for the introducing text, when sending the output to Word, the second for the description.
- wrd
the pointer to a running MS Word instance, as created by GetNewWrd() (for a new one) or by GetCurrWrd() for an existing one. Default is
NULL, which will report all results to the console.- ...
the dots are sent to the internally used function
Phrase(). They can be used to choose the language (lang) or provide variable name (xname).
Value
list with the results calculated by the used functions
See also
Examples
x <- d.pizza$temperature
g <- factor(d.pizza$rabate)
# we can change the colors for the plot by setting the DescToolsOptions
DescToolsOptions(col=c(DescTools::horange, DescTools::hgreen))
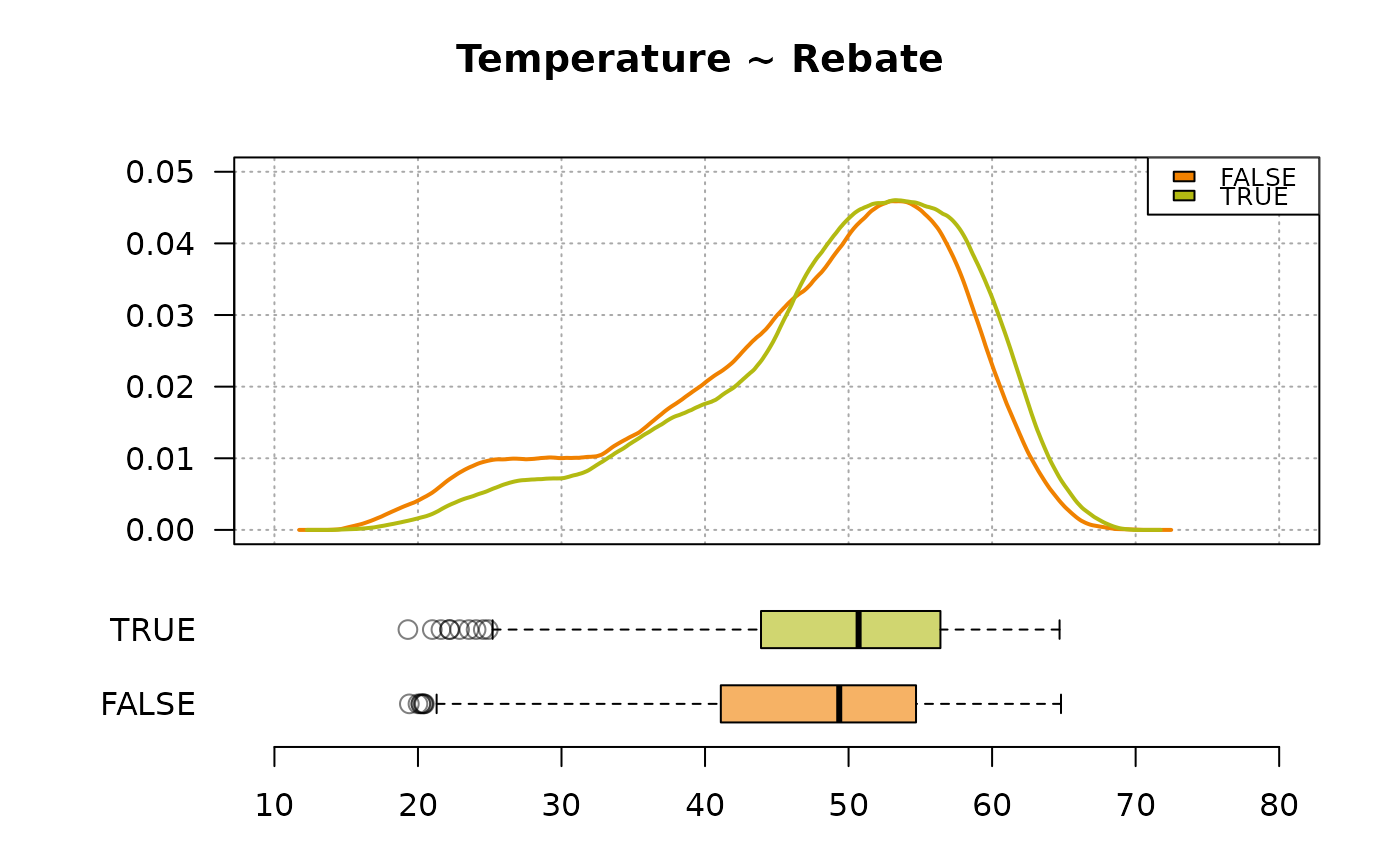
TwoGroups(x, g, main="Temperature ~ Rebate")
#> Temperature ~ Rebate
#>
#> The entire group consists of a total of 1'158 elements. Of these, 580 are FALSE (50.1%, mean x 46.9) and 578 TRUE (49.9%, mean x 49.0).
#> The difference is significant (t-test, p = 2.12e-04) and is -2.15 [-3.29, -1.02] (95% CI).
#>
#> ──────────────────────────────────────────────────────────────────────────────
#> Temperature ~ Rebate
#>
#> Summary:
#> n pairs: 1'209, valid: 1'158 (95.8%), missings: 51 (4.2%), groups: 2
#>
#>
#> FALSE TRUE
#> mean 46.9 49.0
#> median 49.4 50.7
#> sd 10.2 9.5
#> IQR 13.6 12.5
#> n 580 578
#> np 50.1% 49.9%
#> NAs 21 18
#> 0s 0 0
#>
#> Welch Two Sample t-test:
#> t = -4, df = 1149, p-value = 0.0002
#>
#>
#> Warning:
#> Grouping variable contains 12 NAs (0.993%).
#>
 # for an output to Word simply define the wrd argument
# wrd <- GetNewWrd()
# TwoGroups(x, g, font.desc=list(name="Consolas", size=8),
# main="Temperature ~ Rebate", wrd=wrd)
# for an output to Word simply define the wrd argument
# wrd <- GetNewWrd()
# TwoGroups(x, g, font.desc=list(name="Consolas", size=8),
# main="Temperature ~ Rebate", wrd=wrd)