Some Custom Palettes
Pal.RdSome more custom palettes.
Pal(pal, n = 100, alpha = 1)

# S3 method for class 'palette'
plot(x, cex = 3, ...)

hred
horange
hyellow
hecru
hblue
hgreen
Arguments
- pal
name or number of the palette. One of
RedToBlack (1),RedBlackGreen (2),SteeblueWhite (3),RedWhiteGreen (4),RedWhiteBlue0 (5),RedWhiteBlue1 (6),RedWhiteBlue2 (7),RedWhiteBlue3 (8),Helsana (9),Tibco (10),RedGreen1 (11),Spring (12),Soap (13),Maiden (14),Dark (15),Accent (16),Pastel (17),Fragile (18),Big (19),Long (20),Night (21),Dawn (22),Noon (23),Light (24)- n
integer, number of colors for the palette.
- alpha
the alpha value to be added. This can be any value from 0 (fully transparent) to 1 (opaque).
NAis interpreted so as to delete a potential alpha channel. Default is 0.5.- x
a palette to be plotted.
- cex
extension for the color squares. Defaults to 3.
- ...
further arguments passed to the function.
Details
hred, horange, hyellow, hecru, hblue and hgreen are constants, pointing to the according color from the palette Pal("Helsana").
Value
a vector of colors
See also
Examples
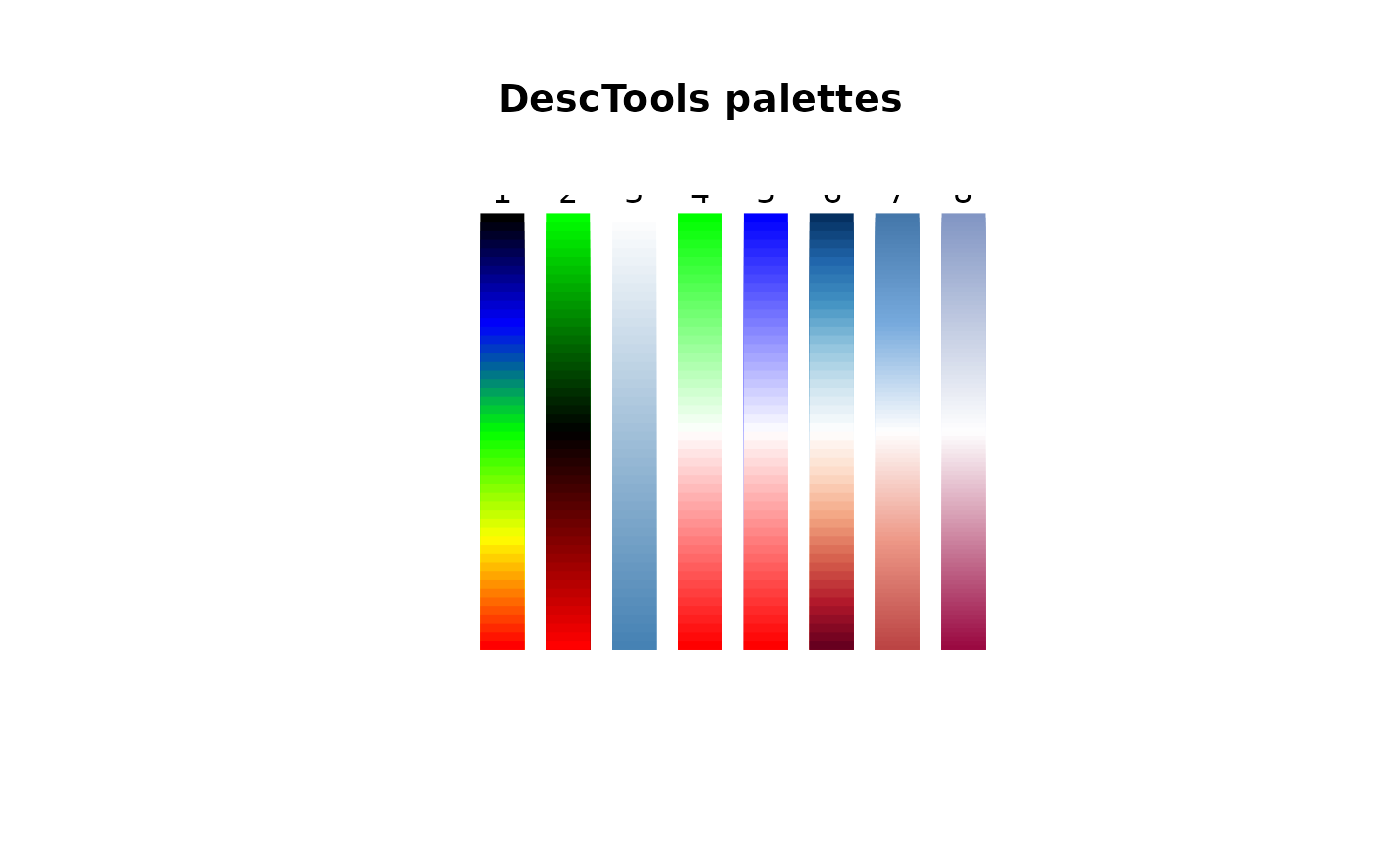
Canvas(c(0,1))
ColorLegend(x=0, y=1, width=0.1, col=Pal(1, n=50))
ColorLegend(x=0.15, y=1, width=0.1, col=Pal(2, n=50))
ColorLegend(x=0.3, y=1, width=0.1, col=Pal(3, n=50))
ColorLegend(x=0.45, y=1, width=0.1, col=Pal(4, n=50))
ColorLegend(x=0.6, y=1, width=0.1, col=Pal(5, n=50))
ColorLegend(x=0.75, y=1, width=0.1, col=Pal(6, n=50))
ColorLegend(x=0.9, y=1, width=0.1, col=Pal(7))
ColorLegend(x=1.05, y=1, width=0.1, col=Pal(8))
text(1:8, y=1.05, x=seq(0,1.05,.15)+.05)
title(main="DescTools palettes")
 par(mfrow=c(4,2), mar=c(1,1,2,1))
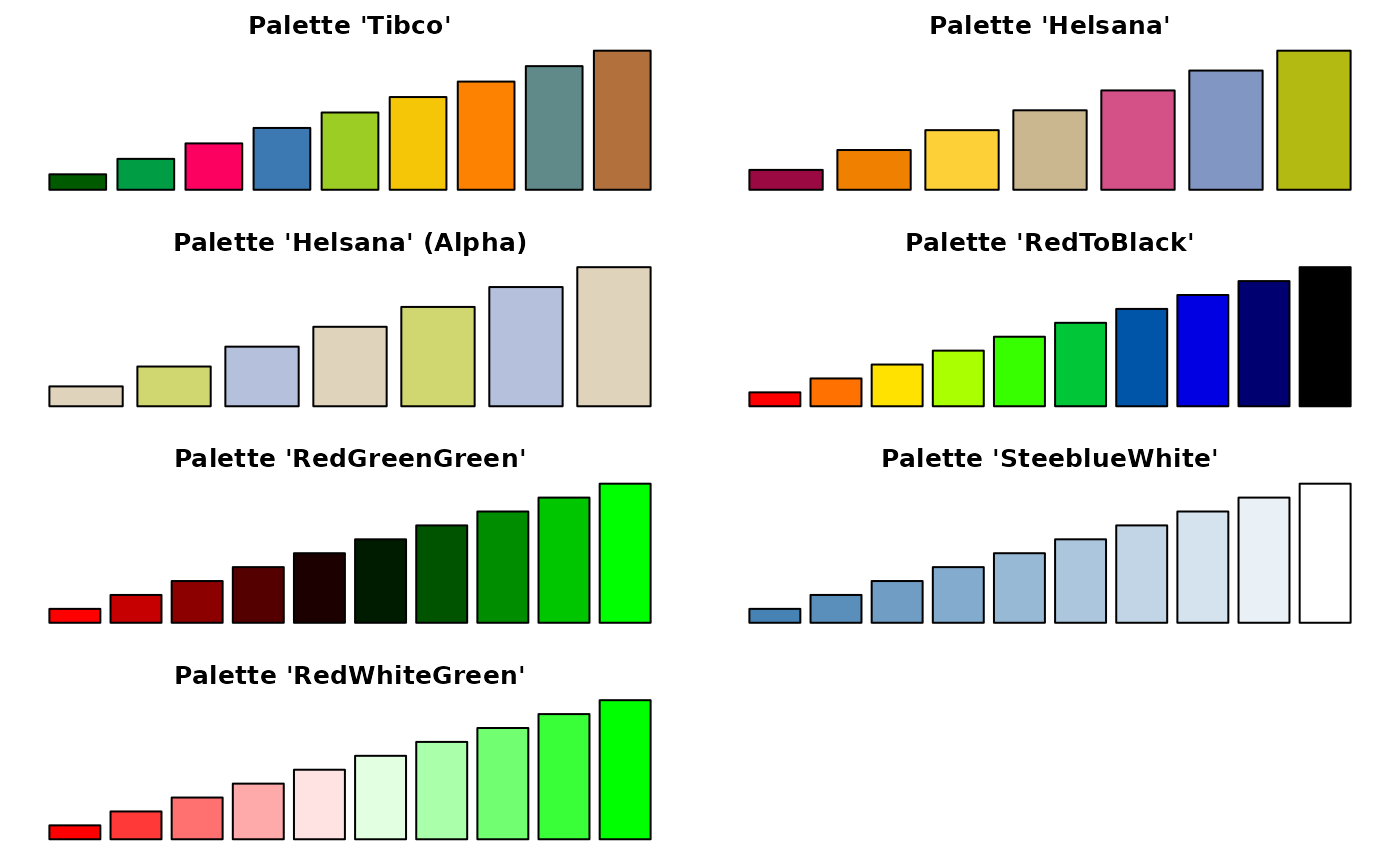
barplot(1:9, col=Pal("Tibco"), axes=FALSE, main="Palette 'Tibco'" )
barplot(1:7, col=Pal("Helsana"), axes=FALSE, main="Palette 'Helsana'" )
barplot(1:7, col=SetAlpha(Pal("Helsana")[c("ecru","hellgruen","hellblau")], 0.6),
axes=FALSE, main="Palette 'Helsana' (Alpha)" )
barplot(1:10, col=Pal("RedToBlack", 10), axes=FALSE, main="Palette 'RedToBlack'" )
barplot(1:10, col=Pal("RedBlackGreen", 10), axes=FALSE, main="Palette 'RedGreenGreen'" )
barplot(1:10, col=Pal("SteeblueWhite", 10), axes=FALSE, main="Palette 'SteeblueWhite'" )
barplot(1:10, col=Pal("RedWhiteGreen", 10), axes=FALSE, main="Palette 'RedWhiteGreen'" )
par(mfrow=c(4,2), mar=c(1,1,2,1))
barplot(1:9, col=Pal("Tibco"), axes=FALSE, main="Palette 'Tibco'" )
barplot(1:7, col=Pal("Helsana"), axes=FALSE, main="Palette 'Helsana'" )
barplot(1:7, col=SetAlpha(Pal("Helsana")[c("ecru","hellgruen","hellblau")], 0.6),
axes=FALSE, main="Palette 'Helsana' (Alpha)" )
barplot(1:10, col=Pal("RedToBlack", 10), axes=FALSE, main="Palette 'RedToBlack'" )
barplot(1:10, col=Pal("RedBlackGreen", 10), axes=FALSE, main="Palette 'RedGreenGreen'" )
barplot(1:10, col=Pal("SteeblueWhite", 10), axes=FALSE, main="Palette 'SteeblueWhite'" )
barplot(1:10, col=Pal("RedWhiteGreen", 10), axes=FALSE, main="Palette 'RedWhiteGreen'" )