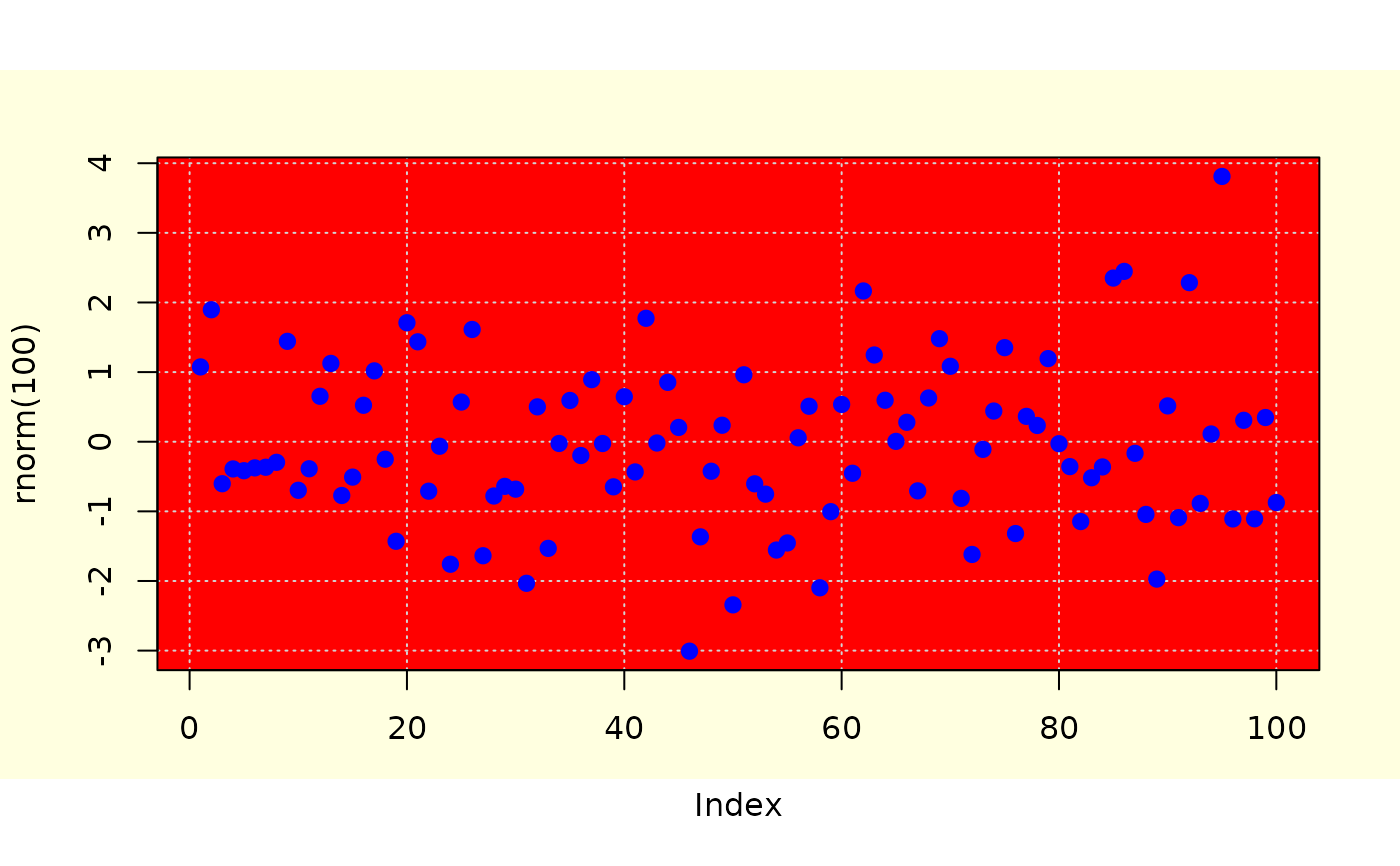
Paints the background of the plot, using either the figure region, the plot region or both. It can sometimes be cumbersome to elaborate the coordinates and base R does not provide a simple function for that.
Usage
setBackCol(col = "grey", region = c("plot", "figure"), border = NA)Value
No return value (invisible NULL), called for its side effect of
painting the background of the current plot.
See also
Other graphics.setup:
canvas(),
polarGrid()