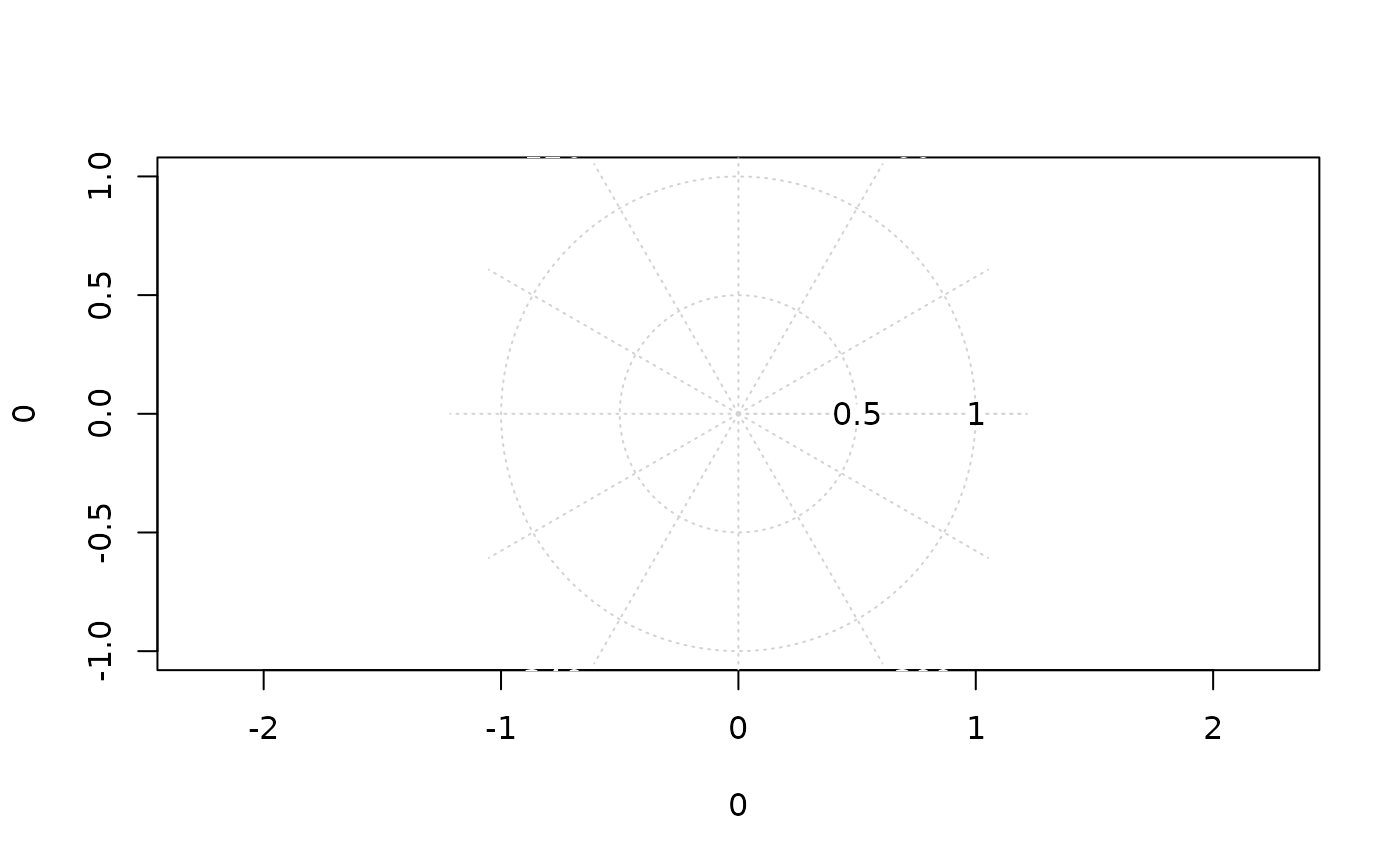
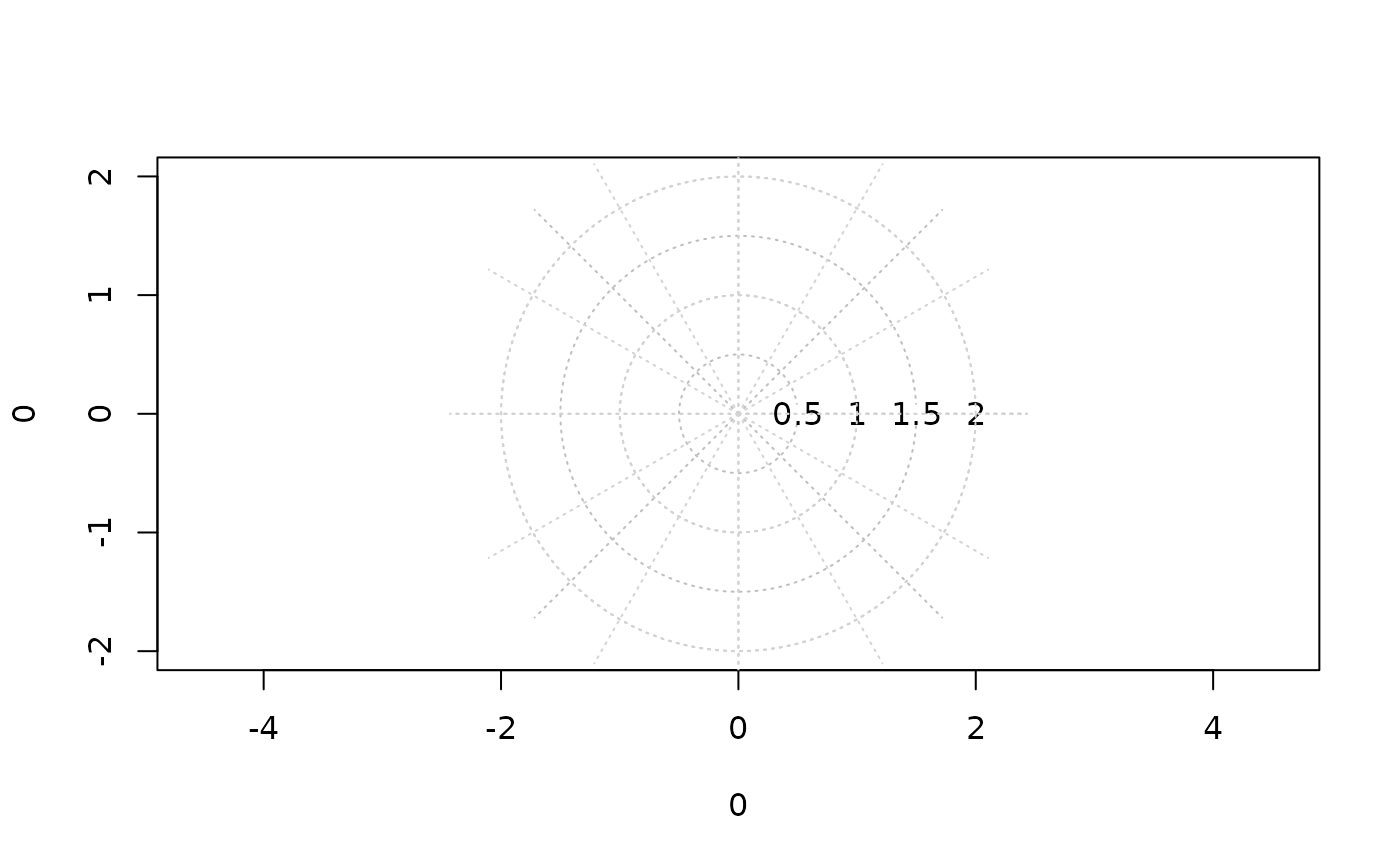
Adds a polar coordinate grid (circles and radial lines) to an existing plot. Optionally includes labels for radii and angles.
Usage
polarGrid(
  nRadial = NULL,
  nAngular = NULL,
  radialLabels = NULL,
  angleLabels = NULL,
  labelRadians = FALSE,
  col = "lightgray",
  lty = "dotted",
  lwd = par("lwd"),
  cex = 1,
  las = 1,
  adj = NULL,
  dist = NULL
)
Arguments
- nRadial
numeric or vector controlling radial grid lines:
NULLUses default "pretty" axis values.
- single numeric
Number of radial grid lines.
- numeric vector
Explicit radii at which to draw circles.
- all
NA Suppress radial grid lines.
- nAngular
numeric or vector controlling angular grid lines:
NULLUses 12 equally spaced angles.
- single numeric
Number of angular divisions.
- numeric vector
Explicit angles (in radians).
- all
NA Suppress angular grid lines.
- radialLabels
optional labels for radial grid lines (excluding zero). If
NULL, labels are generated automatically. UseNAto suppress labels.- angleLabels
optional labels for angular grid lines. If
NULL, labels are generated automatically (degrees or radians). UseNAto suppress labels.- labelRadians
logical; if
TRUE, angle labels are shown in radians, otherwise in degrees.- col
color of grid lines.
- lty
line type for grid lines.
- lwd
line width for grid lines.
- cex
character expansion factor for the labels.
- las
integer controlling label orientation (as in
graphics::par()).- adj
numeric vector specifying text justification.
- dist
numeric distance from origin for angular labels.
Details
This function is intended to be used together with polar plotting functions
such as plotPolar. It assumes an existing plot with equal aspect ratio.
Radial grid lines are drawn as concentric circles, while angular grid lines are drawn as segments from the origin.
Label placement and formatting can be customized via adj, las,
and dist.
See also
Other graphics.setup:
canvas(),
setBackCol()