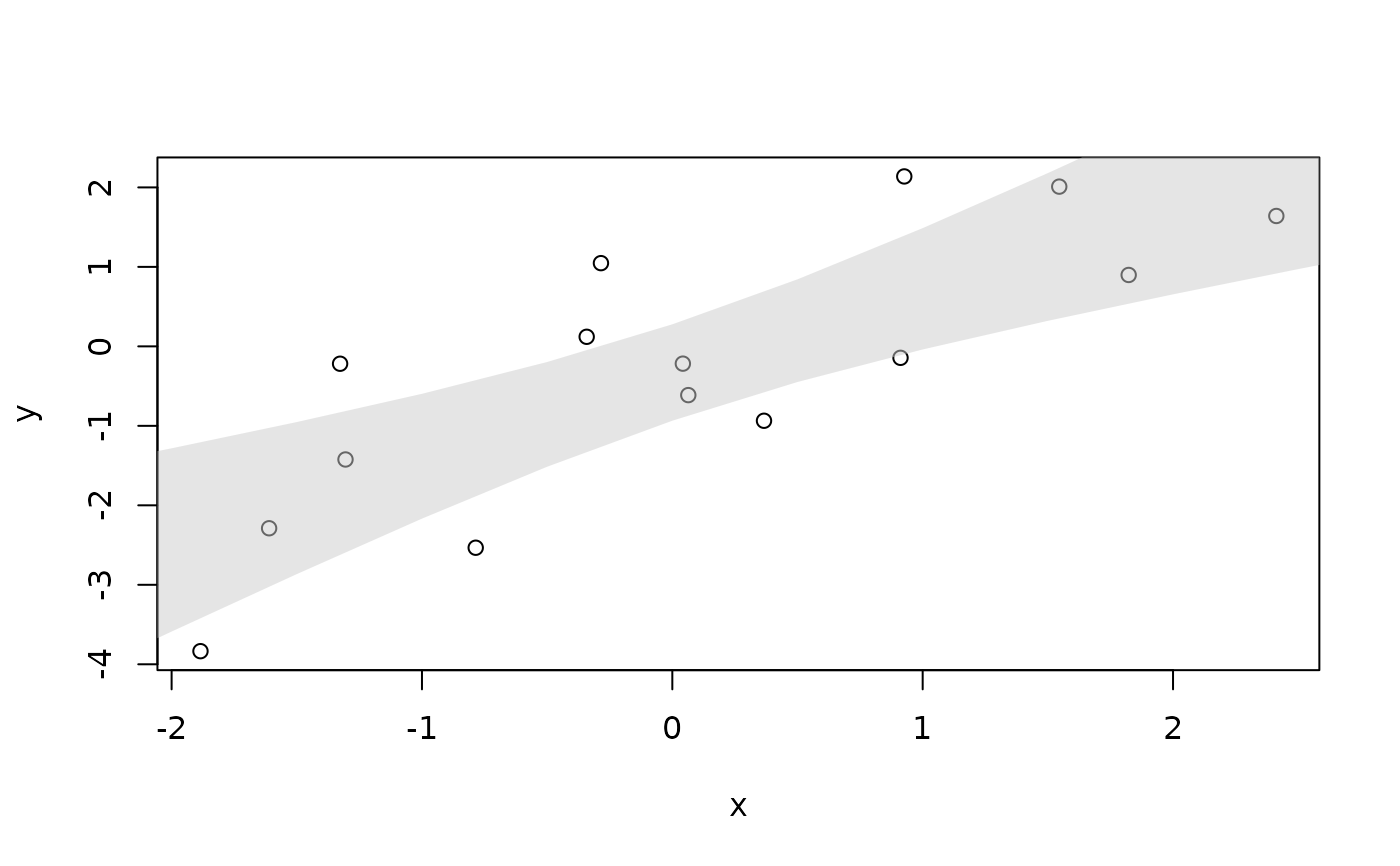
Create a polygonal band from upper and lower boundaries.
See also
Other geometry.structures:
arc(),
bezier(),
circle(),
ellipse(),
polygonX(),
regPolygon(),
ring()
Examples
set.seed(18)

x <- rnorm(15)
y <- x + rnorm(15)

new <- seq(-3, 3, 0.5)

pred <- predict(
  lm(y ~ x),
  newdata = data.frame(x = new),
  interval = "confidence"
)

plot(y ~ x)

polygonX(
  band(
    x = new,
    y = pred[,2:3]
  ),
  col = addOpacity("grey80", 0.5),
  border = NA
)