Add a Loess or a Spline Smoother
lines.loess.RdAdd a loess smoother to an existing plot. The function first calculates the prediction of a loess object for a reasonable amount of points, then adds the line to the plot and inserts a polygon with the confidence intervals.
# S3 method for class 'loess'
lines(x, col = Pal()[1], lwd = 2, lty = "solid",
      type = "l", n = 100, conf.level = 0.95, args.band = NULL, ...)

# S3 method for class 'smooth.spline'
lines(x, col = Pal()[1], lwd = 2, lty = "solid",
      type = "l", conf.level = 0.95, args.band = NULL, ...)

# S3 method for class 'SmoothSpline'
lines(x, col = Pal()[1], lwd = 2, lty = "solid",
      type = "l", conf.level = 0.95, args.band = NULL, ...)
Arguments
- x
the loess or smooth.spline object to be plotted.
- col
linecolor of the smoother. Default is DescTools's
col1.- lwd
line width of the smoother.
- lty
line type of the smoother.
- type
type of plot, defaults to
"l".- n
number of points used for plotting the fit.
- conf.level
confidence level for the confidence interval. Set this to NA, if no confidence band should be plotted. Default is 0.95.
- args.band
list of arguments for the confidence band, such as color or border (see
DrawBand).- ...
further arguments are passed to the smoother (
loess()orSmoothSpline()).
Note
Loess can result in heavy computational load if there are many points!
See also
Examples
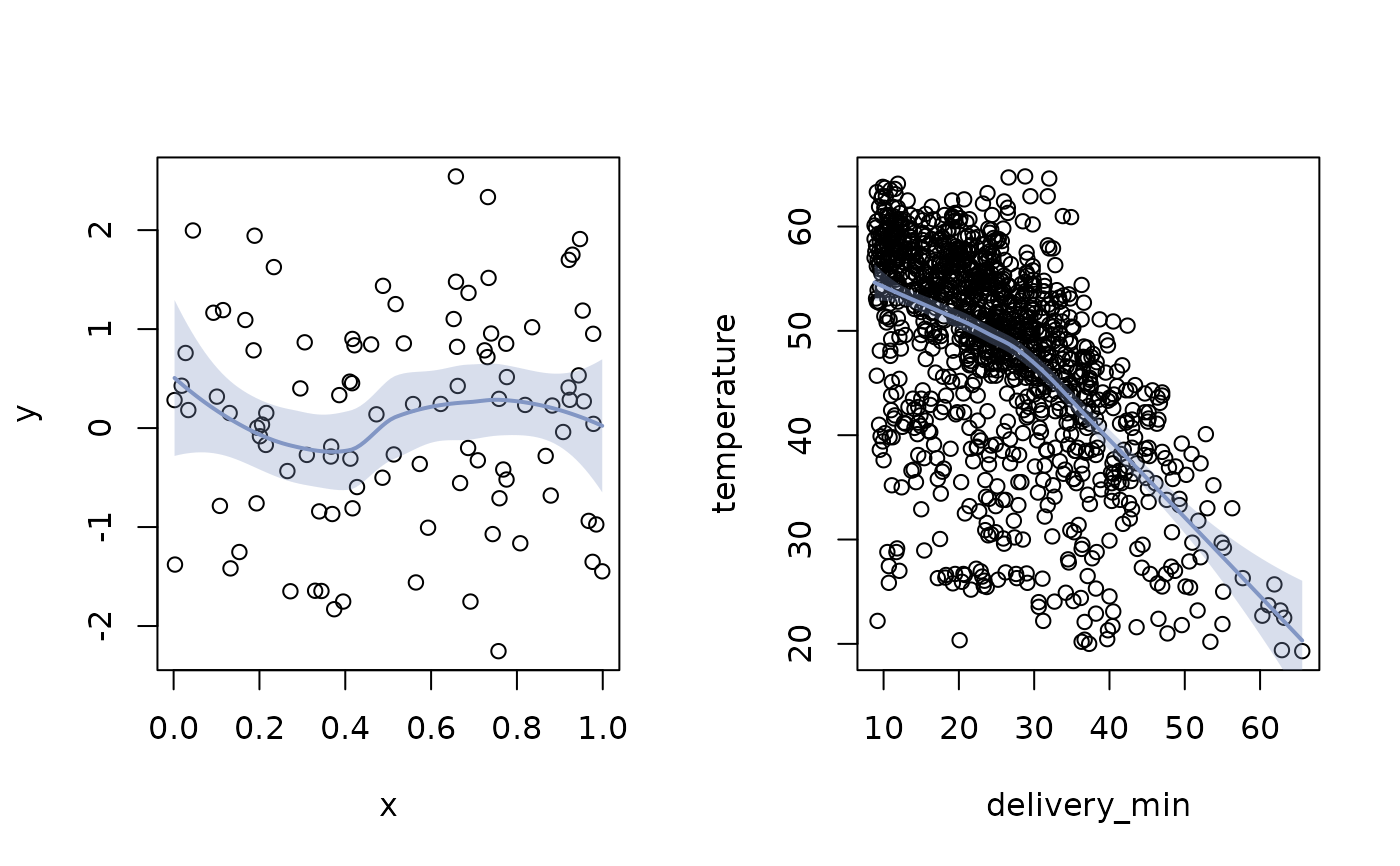
par(mfrow=c(1,2))

x <- runif(100)
y <- rnorm(100)
plot(x, y)
lines(loess(y~x))

plot(temperature ~ delivery_min, data=d.pizza)
lines(loess(temperature ~ delivery_min, data=d.pizza))


plot(temperature ~ delivery_min, data=d.pizza)
lines(loess(temperature ~ delivery_min, data=d.pizza), conf.level = 0.99,
            args.band = list(col=SetAlpha("red", 0.4), border="black") )

# the default values from scatter.smooth
lines(loess(temperature ~ delivery_min, data=d.pizza,
            span=2/3, degree=1, family="symmetric"), col="red")
plot(temperature ~ delivery_min, data=d.pizza)
lines(loess(temperature ~ delivery_min, data=d.pizza), conf.level = 0.99,
args.band = list(col=SetAlpha("red", 0.4), border="black") )
# the default values from scatter.smooth
lines(loess(temperature ~ delivery_min, data=d.pizza,
span=2/3, degree=1, family="symmetric"), col="red")