Extended Scatterplot Matrices
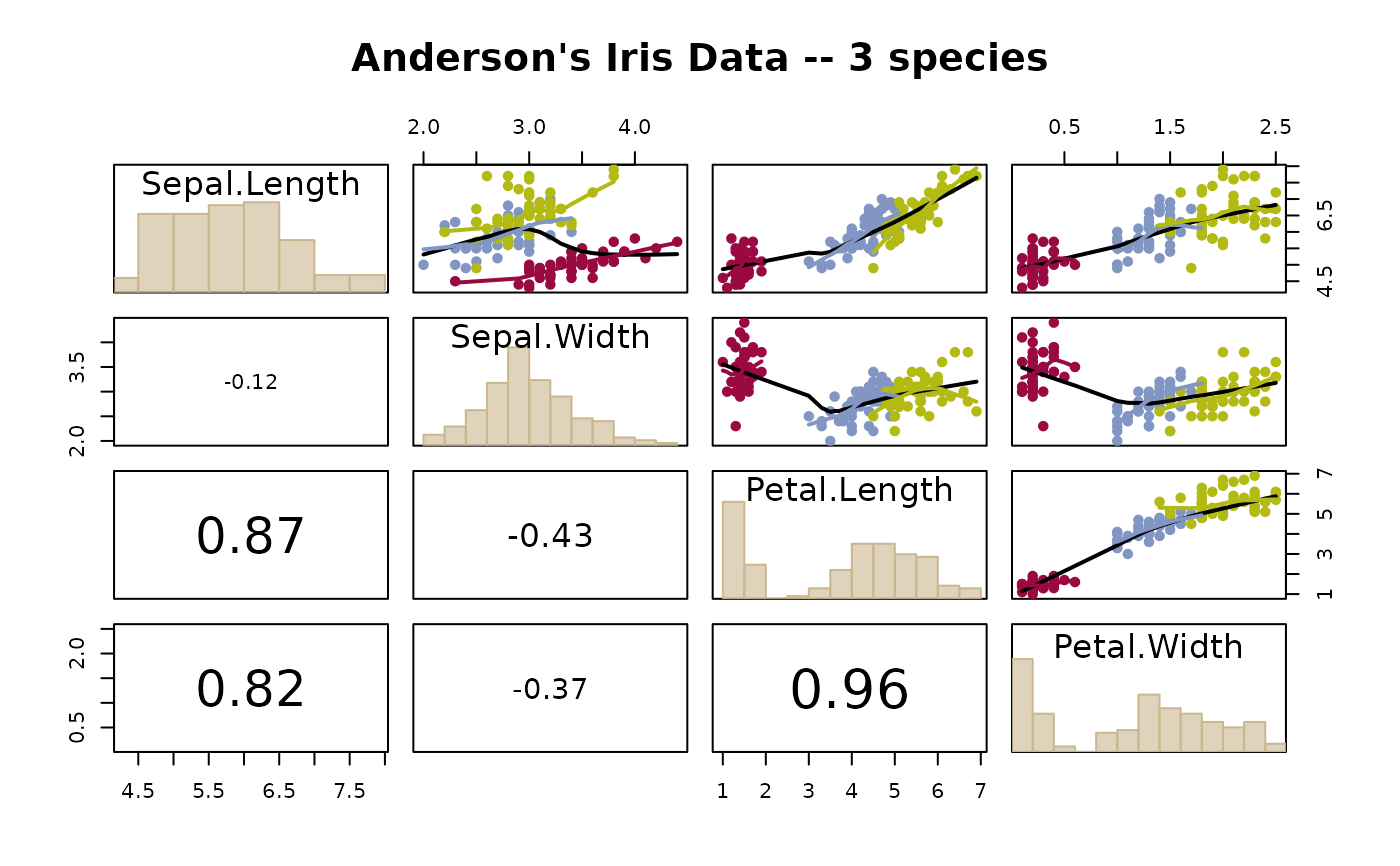
PlotPairs.RdA matrix of scatterplots is produced.The upper triangular matrices contain nothing else than the correlation coefficient. The diagonal displays a histogram of the variable. The lower triangular matrix displays a scatterplot superposed by a smoother. It's possible to define groups to be differntiated by color and also by individual smoothers.
The used code is not much more than the pairs() code and some examples, but condenses it to a practical amount.
PlotPairs(x, g = NULL, col = 1, pch = 19, col.smooth = 1, main = "",
          upper = FALSE, ...)
Arguments
- x
the coordinates of points given as numeric columns of a matrix or data frame. Logical and factor columns are converted to numeric in the same way that data.matrix does. Will directly be passed on to
pairs.- g
a group variable
- col
color for pointcharacter
- pch
point character
- col.smooth
color for the smoother(s)
- main
the main title
- upper
logical, determines if the correlation coefficients should be displayed in the upper triangular matrix (default) or in the lower one.
- ...
additional arguments passed to
pairsfunction.