Plot a Function
PlotFun.RdPlots mathematical expressions in one variable using the formula syntax.
Arguments
- FUN
a mathematical expression defined using the formula syntax:
f(x) ~ x. x and y can as well be functions of a parameter t:y(t) ~ x(t)(see examples).- args
a list of additional parameters defined in the expression besides the independent variable.
- from, to
the range over which the function will be plotted.
- by
number: increment of the sequence.
- xlim, ylim
NULLor a numeric vector of length 2; if non-NULL it provides the defaults forc(from, to)and, unlessadd=TRUE, selects the x-limits of the plot - seeplot.window.- polar
logical. Should polar coordinates be used? Defaults to
FALSE.- type
plot type: see
plot.default- col
colors of the lines.
- lwd
line widths for the lines.
- lty
line type of the lines.
- pch
plotting 'character', i.e., symbol to use.
- mar
A numerical vector of the form
c(bottom, left, top, right)which gives the number of lines of margin to be specified on the four sides of the plot. The default isc(3,3,3,3).- add
logical; if
TRUEadd to an already existing plot; ifNAstart a new plot taking the defaults for the limits and log-scaling of the x-axis from the previous plot. Taken asFALSE(with a warning if a different value is supplied) if no graphics device is open.- ...
the dots are passed to the plot, resp. lines function.
Details
A function can be plotted with curve. This function here adds some more features, one enabling to use a formula for defining the function to plot.
This enables as well a parametric equation to be entered straight forward. Parameters of a function can be set separatedly.
The aspect ratio y/x will be set to 1 by default. (See plot.window for details.)
If the argument axes (given in the dots) is not set to FALSE centered axis at a horizontal and vertical position of 0 will be drawn, containing major and minor ticks.
See also
Examples
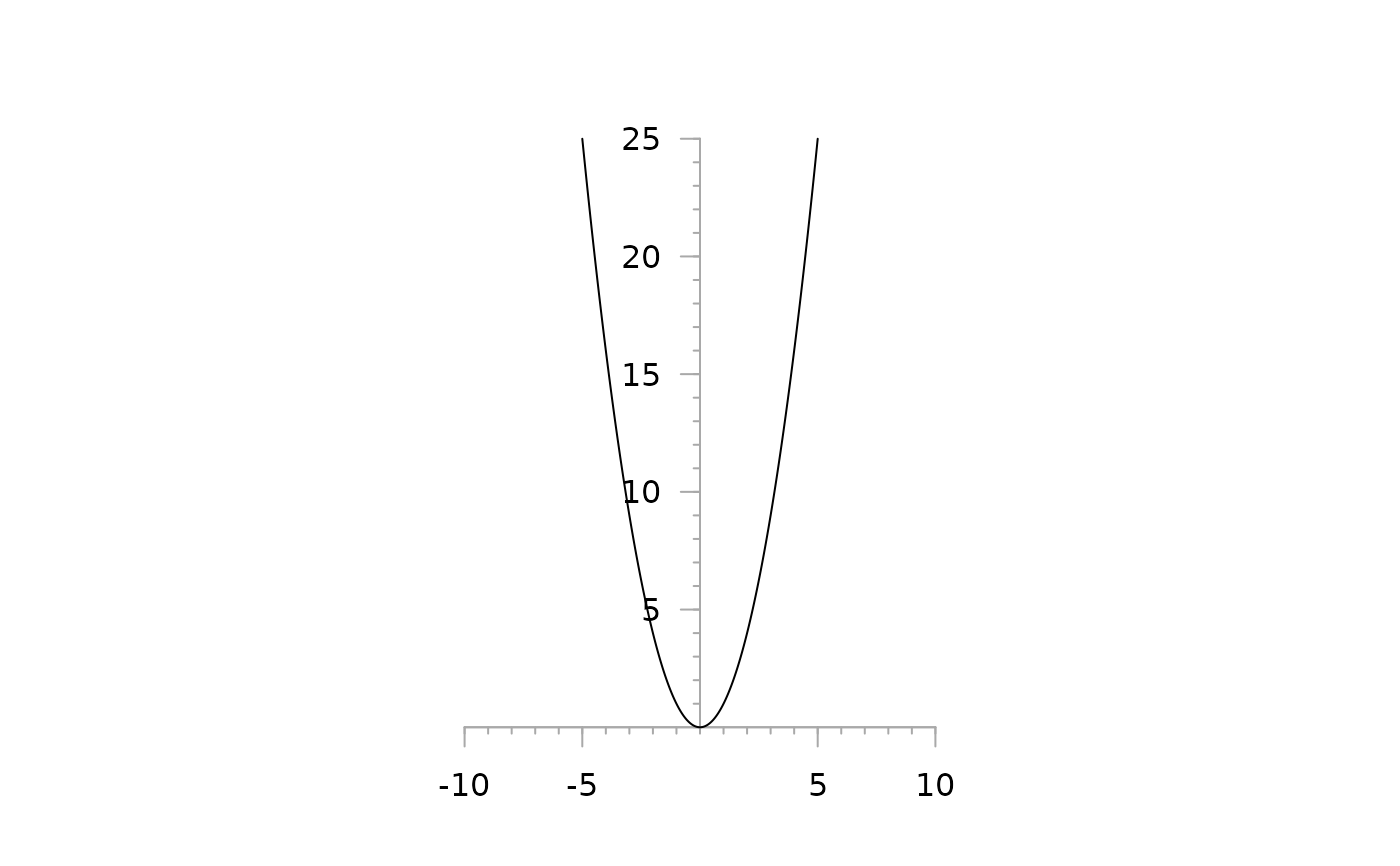
# simple quadratic function y = x^2
PlotFun(x^2 ~ x)
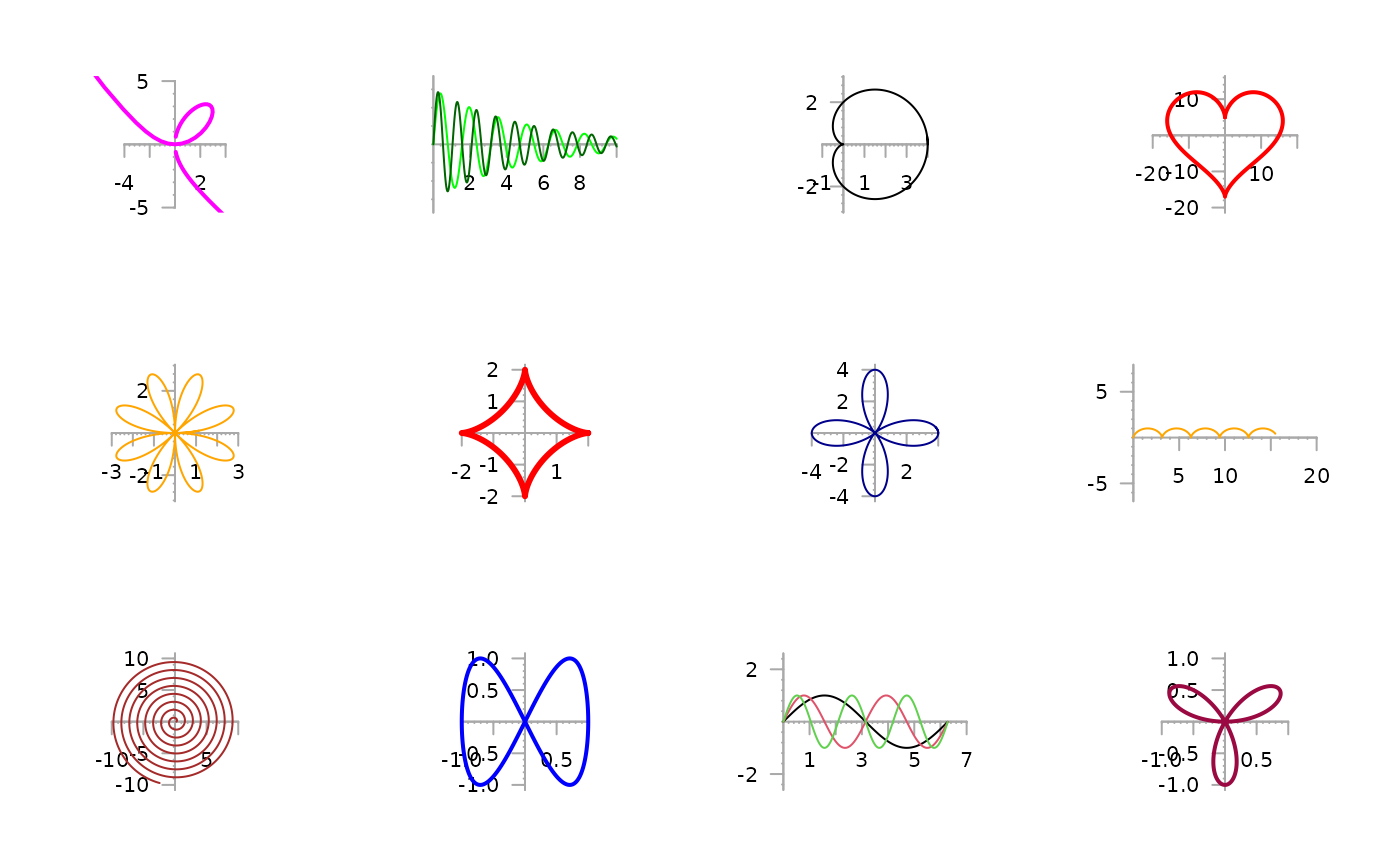
 par(mfrow=c(3,4))
# Cartesian leaf
PlotFun(3*a*z^2 /(z^3+1) ~ 3*a*z /(z^3+1+b), args=list(a=2, b=.1), from=-10, to=10, by=0.1,
xlim=c(-5,5), ylim=c(-5,5), col="magenta", asp=1, lwd=2 )
# family of functions
PlotFun(a*exp(-x/5)*sin(n*x) ~ x, args=list(n=4, a=3), from=0, to=10, by=0.01,
col="green")
PlotFun(a*exp(-x/5)*sin(n*x) ~ x, args=list(n=6, a=3), from=0, to=10, by=0.01,
col="darkgreen", add=TRUE)
# cardioid
PlotFun(a*(1+cos(t)) ~ t, args=list(a=2), polar=TRUE, from=0, to=2*pi+0.1, by=0.01, asp=1)
PlotFun(13*cos(t) - 5*cos(2*t) - 2*cos(3*t) - cos(4*t) ~ 16*sin(t)^3,
from=0, to=2*pi, by=0.01, asp=1, xlim=c(-20,20), col="red", lwd=2)
PlotFun(a*sin(2*t)*cos(2*t) ~ t, args=list(a=6), polar=TRUE, from=0, to=2*pi+0.1, by=0.01,
col="orange")
# astroid
PlotFun(a*sin(t)^3 ~ a*cos(t)^3, args=list(a=2), from=0, to=2*pi+0.1, lwd=3, by=0.01,
col="red")
# lemniscate of Bernoulli
PlotFun((2*a^2*cos(2*t))^2 ~ t, args=list(a=1), polar=TRUE, from=0, to=2*pi+0.1, by=0.01,
col="darkblue")
# Cycloid
PlotFun(a*(1-cos(t)) ~ a*(t-sin(t)), args=list(a=0.5), from=0, to=30, by=0.01,
col="orange")
# Kreisevolvente
PlotFun(a*(sin(t) - t*cos(t)) ~ a*(cos(t) + t*sin(t)), args=list(a=0.2), from=0, to=50, by=0.01,
col="brown")
PlotFun(sin(2*t) ~ sin(t), from=0, to=2*pi, by=0.01, col="blue", lwd=2)
# multiple values for one parameter
sapply(1:3, function(a) PlotFun(sin(a*x) ~ x,
args=list(a=a), from=0, to=2*pi, by=0.01,
add=(a!=1), col=a))
#> [,1] [,2] [,3]
#> x AsIs,629 AsIs,629 AsIs,629
#> y AsIs,629 AsIs,629 AsIs,629
PlotFun(sin(3*x) ~ x, polar=TRUE, from=0, to=pi, by=0.001, col=DescTools::hred, lwd=2)
par(mfrow=c(3,4))
# Cartesian leaf
PlotFun(3*a*z^2 /(z^3+1) ~ 3*a*z /(z^3+1+b), args=list(a=2, b=.1), from=-10, to=10, by=0.1,
xlim=c(-5,5), ylim=c(-5,5), col="magenta", asp=1, lwd=2 )
# family of functions
PlotFun(a*exp(-x/5)*sin(n*x) ~ x, args=list(n=4, a=3), from=0, to=10, by=0.01,
col="green")
PlotFun(a*exp(-x/5)*sin(n*x) ~ x, args=list(n=6, a=3), from=0, to=10, by=0.01,
col="darkgreen", add=TRUE)
# cardioid
PlotFun(a*(1+cos(t)) ~ t, args=list(a=2), polar=TRUE, from=0, to=2*pi+0.1, by=0.01, asp=1)
PlotFun(13*cos(t) - 5*cos(2*t) - 2*cos(3*t) - cos(4*t) ~ 16*sin(t)^3,
from=0, to=2*pi, by=0.01, asp=1, xlim=c(-20,20), col="red", lwd=2)
PlotFun(a*sin(2*t)*cos(2*t) ~ t, args=list(a=6), polar=TRUE, from=0, to=2*pi+0.1, by=0.01,
col="orange")
# astroid
PlotFun(a*sin(t)^3 ~ a*cos(t)^3, args=list(a=2), from=0, to=2*pi+0.1, lwd=3, by=0.01,
col="red")
# lemniscate of Bernoulli
PlotFun((2*a^2*cos(2*t))^2 ~ t, args=list(a=1), polar=TRUE, from=0, to=2*pi+0.1, by=0.01,
col="darkblue")
# Cycloid
PlotFun(a*(1-cos(t)) ~ a*(t-sin(t)), args=list(a=0.5), from=0, to=30, by=0.01,
col="orange")
# Kreisevolvente
PlotFun(a*(sin(t) - t*cos(t)) ~ a*(cos(t) + t*sin(t)), args=list(a=0.2), from=0, to=50, by=0.01,
col="brown")
PlotFun(sin(2*t) ~ sin(t), from=0, to=2*pi, by=0.01, col="blue", lwd=2)
# multiple values for one parameter
sapply(1:3, function(a) PlotFun(sin(a*x) ~ x,
args=list(a=a), from=0, to=2*pi, by=0.01,
add=(a!=1), col=a))
#> [,1] [,2] [,3]
#> x AsIs,629 AsIs,629 AsIs,629
#> y AsIs,629 AsIs,629 AsIs,629
PlotFun(sin(3*x) ~ x, polar=TRUE, from=0, to=pi, by=0.001, col=DescTools::hred, lwd=2)
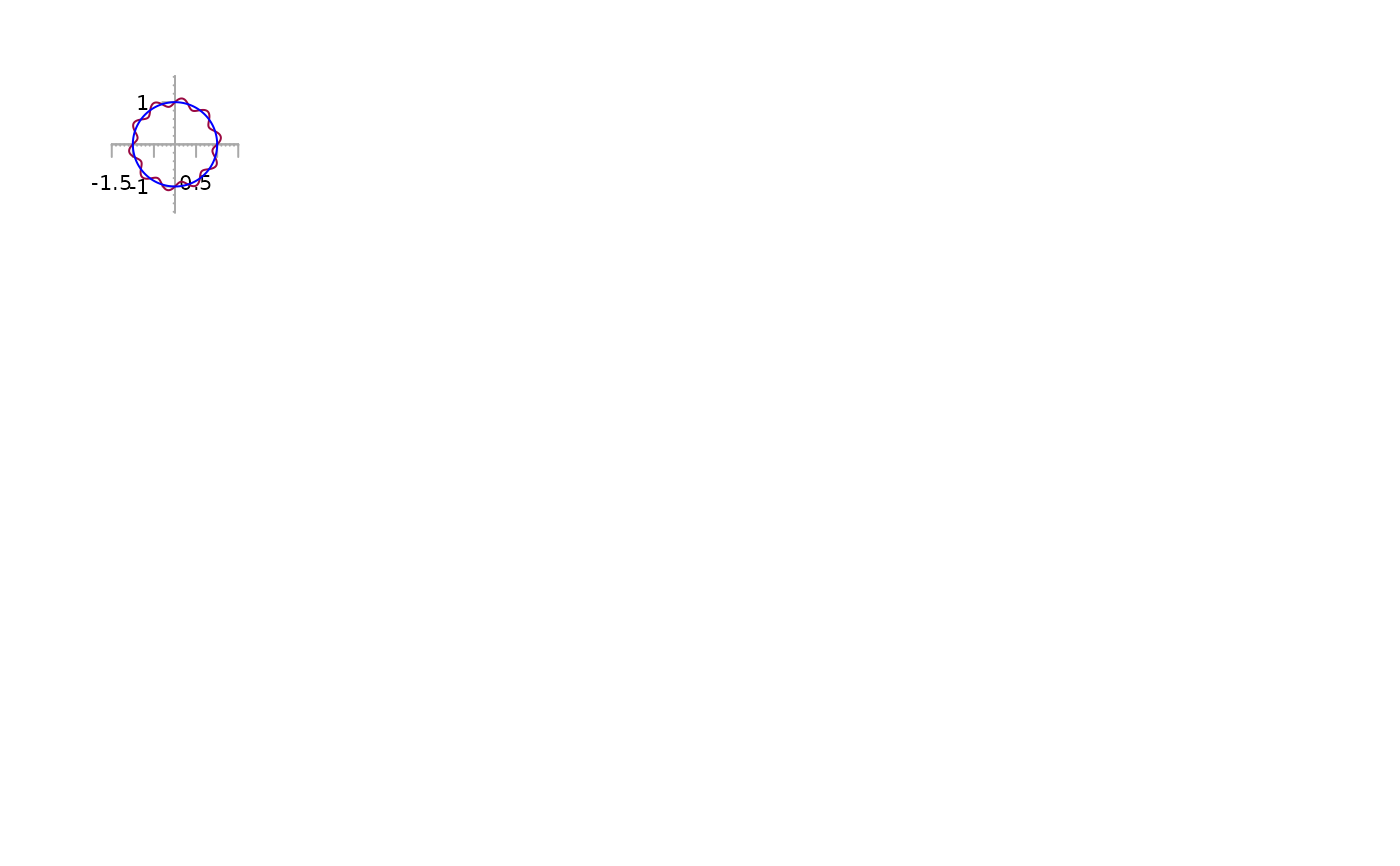
 PlotFun(1 + 1/10 * sin(10*x) ~ x, polar=TRUE, from=0, to=2*pi, by=0.001,
col=DescTools::hred)
PlotFun(sin(x) ~ cos(x), polar=FALSE, from=0, to=2*pi, by=0.01, add=TRUE, col="blue")
PlotFun(1 + 1/10 * sin(10*x) ~ x, polar=TRUE, from=0, to=2*pi, by=0.001,
col=DescTools::hred)
PlotFun(sin(x) ~ cos(x), polar=FALSE, from=0, to=2*pi, by=0.01, add=TRUE, col="blue")