Empirical Cumulative Distribution Function
PlotECDF.RdFaster alternative for plotting the empirical cumulative distribution function (ecdf). The function offers the option to construct the ecdf on the base of a histogram, which makes sense, when x is large. So the plot process is much faster, without loosing much precision in the details.
PlotECDF(x, breaks = NULL, col = Pal()[1], ylab = "",
         lwd = 2, xlab = NULL, ...)
Arguments
- x
numeric vector of the observations for ecdf.
- breaks
will be passed directly to
hist. If left toNULL, no histogram will be used.- col
color of the line.
- ylab
label for the y-axis.
- lwd
line width.
- xlab
label for the x-axis.
- ...
arguments to be passed to subsequent functions.
Details
The stats function plot.ecdf is fine for vectors that are not too large. However for n ~ 1e7 we would observe a dramatic performance breakdown (possibly in combination with the use of do.call).
PlotECDF is designed as alternative for quicker plotting the ecdf for larger vectors. If breaks are provided as argument, a histogram with that number of breaks will be calculated and the ecdf will use those frequencies instead of respecting every single point.
Note that a plot will rarely need more than ~1'000 points on x to have a sufficient resolution on usual terms. PlotFdist will also use this number of breaks by default.
Value
no value returned, use plot.ecdf if any results are required.
Examples
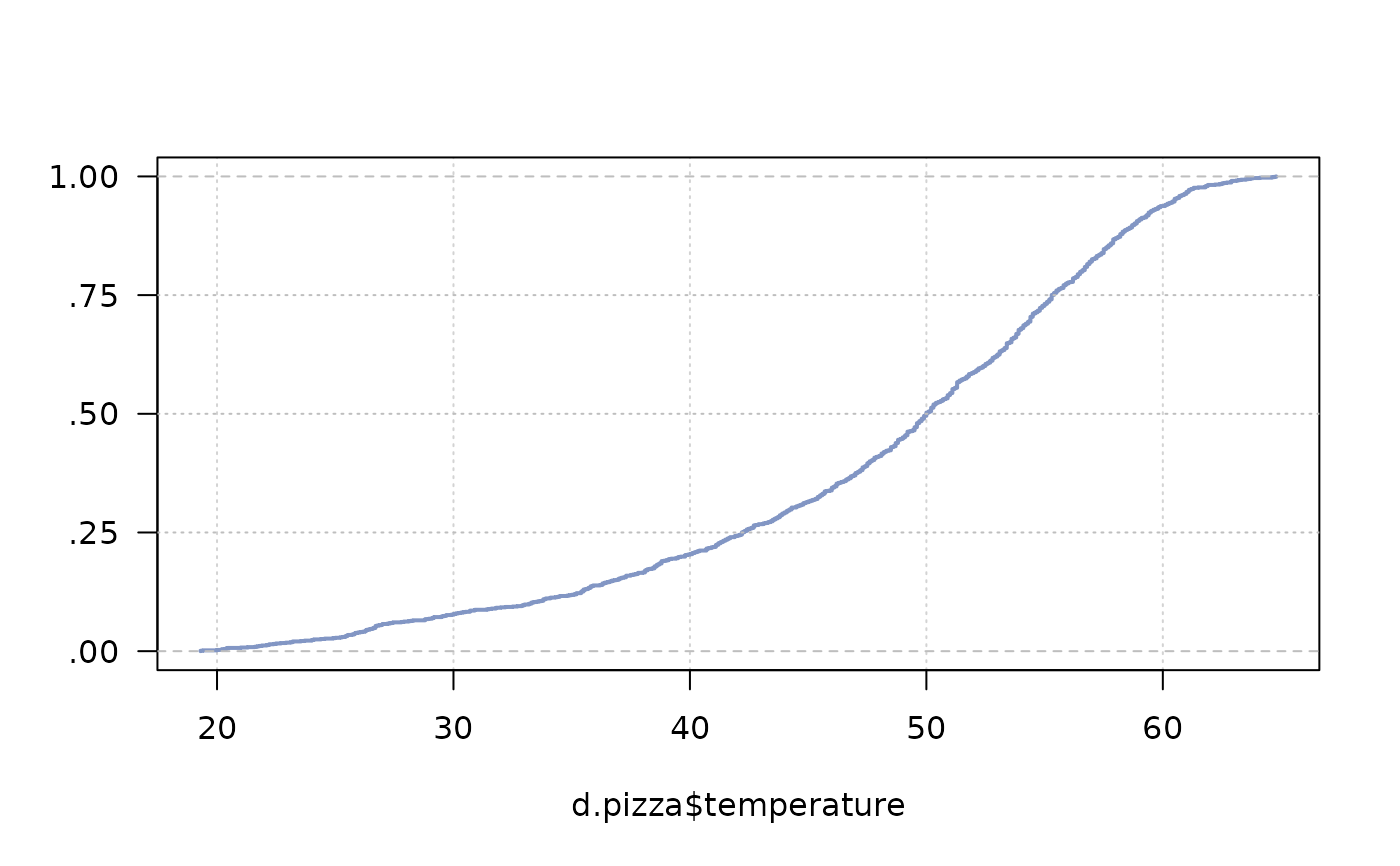
PlotECDF(d.pizza$temperature)
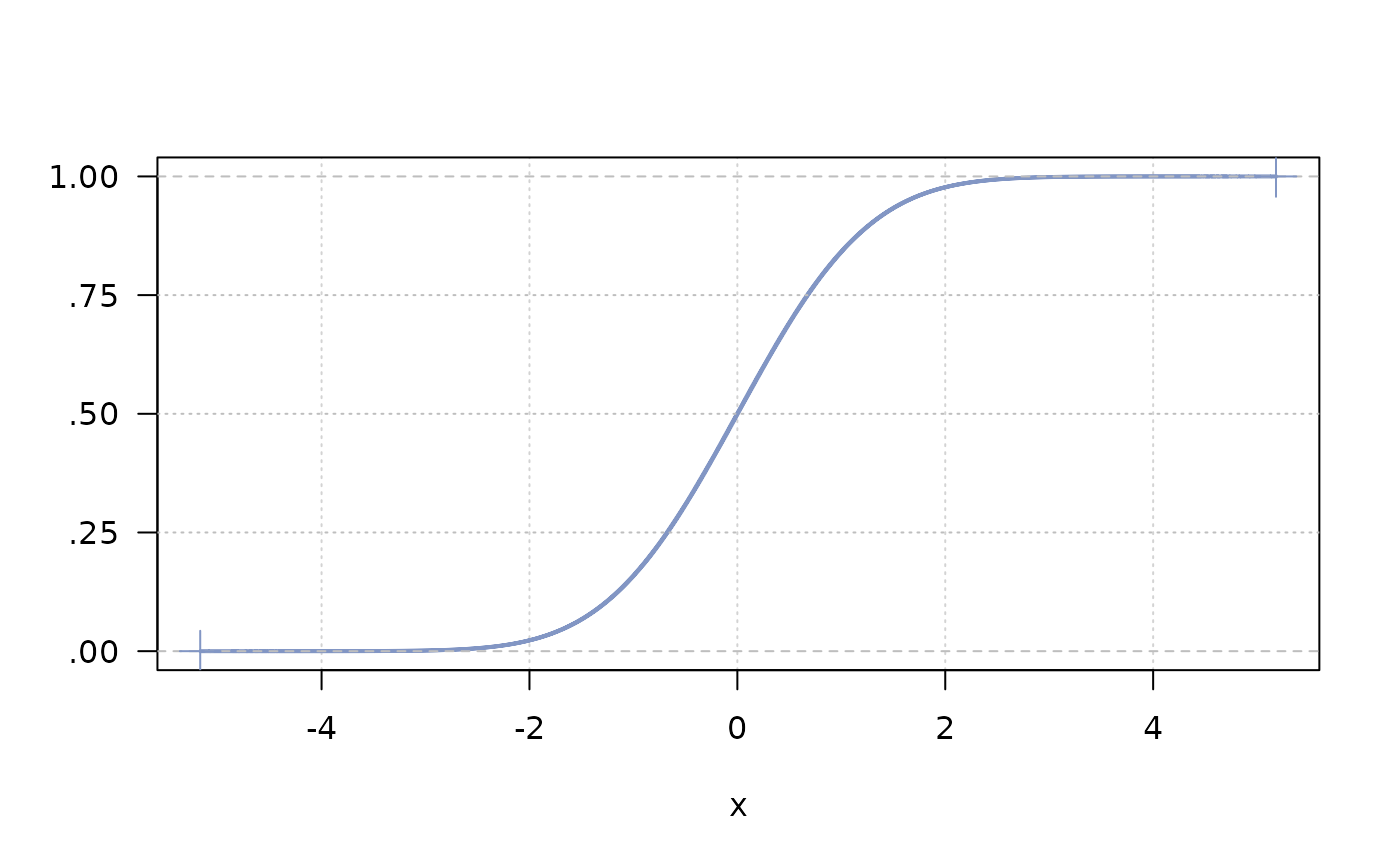
 # make large vector
x <- rnorm(n=1e7)
# plot only 1000 points instead of 1e7
PlotECDF(x, breaks=1000)
# make large vector
x <- rnorm(n=1e7)
# plot only 1000 points instead of 1e7
PlotECDF(x, breaks=1000)