Plot a Correlation Matrix
PlotCorr.RdThis function produces a graphical display of a correlation matrix. The cells of the matrix can be shaded or colored to show the correlation value.
PlotCorr(x, cols = colorRampPalette(c(Pal()[2], "white",
                                      Pal()[1]), space = "rgb")(20),
         breaks = seq(-1, 1, length = length(cols) + 1),
         border = "grey", lwd = 1,
         args.colorlegend = NULL, xaxt = par("xaxt"), yaxt = par("yaxt"),
         cex.axis = 0.8, las = 2, mar = c(3, 8, 8, 8), mincor = 0,
         main = "", clust = FALSE, ...)
Arguments
- x
x is a correlation matrix to be visualized.
- cols
the colors for shading the matrix. Uses the package's option
"col1"and"col2"as default.- breaks
a set of breakpoints for the colours: must give one more breakpoint than colour. These are passed to
image()function. If breaks is specified then the algorithm used followscut, so intervals are closed on the right and open on the left except for the lowest interval.- border
color for borders. The default is
grey. Set this argument toNAif borders should be omitted.- lwd
line width for borders. Default is 1.
- args.colorlegend
list of arguments for the
ColorLegend. UseNAif no color legend should be painted.- xaxt
parameter to define, whether to draw an x-axis, defaults to
"n".- yaxt
parameter to define, whether to draw an y-axis, defaults to
"n".- cex.axis
character extension for the axis labels.
- las
the style of axis labels.
- mar
sets the margins, defaults to mar = c(3, 8, 8, 8) as we need a bit more room on the right.
- mincor
numeric value between 0 and 1, defining the smallest correlation that is to be displayed. If this is >0 then all correlations with a lower value are suppressed.
- main
character, the main title.
- clust
logical. If set to
TRUE, the correlations will be clustered in order to aggregate similar values.- ...
the dots are passed to the function
image, which produces the plot.
Value
no values returned.
See also
image, ColorLegend, corrgram(), PlotWeb()
Examples
m <- cor(d.pizza[,sapply(d.pizza, IsNumeric, na.rm=TRUE)], use="pairwise.complete.obs")
PlotCorr(m, cols=colorRampPalette(c("red", "black", "green"), space = "rgb")(20))
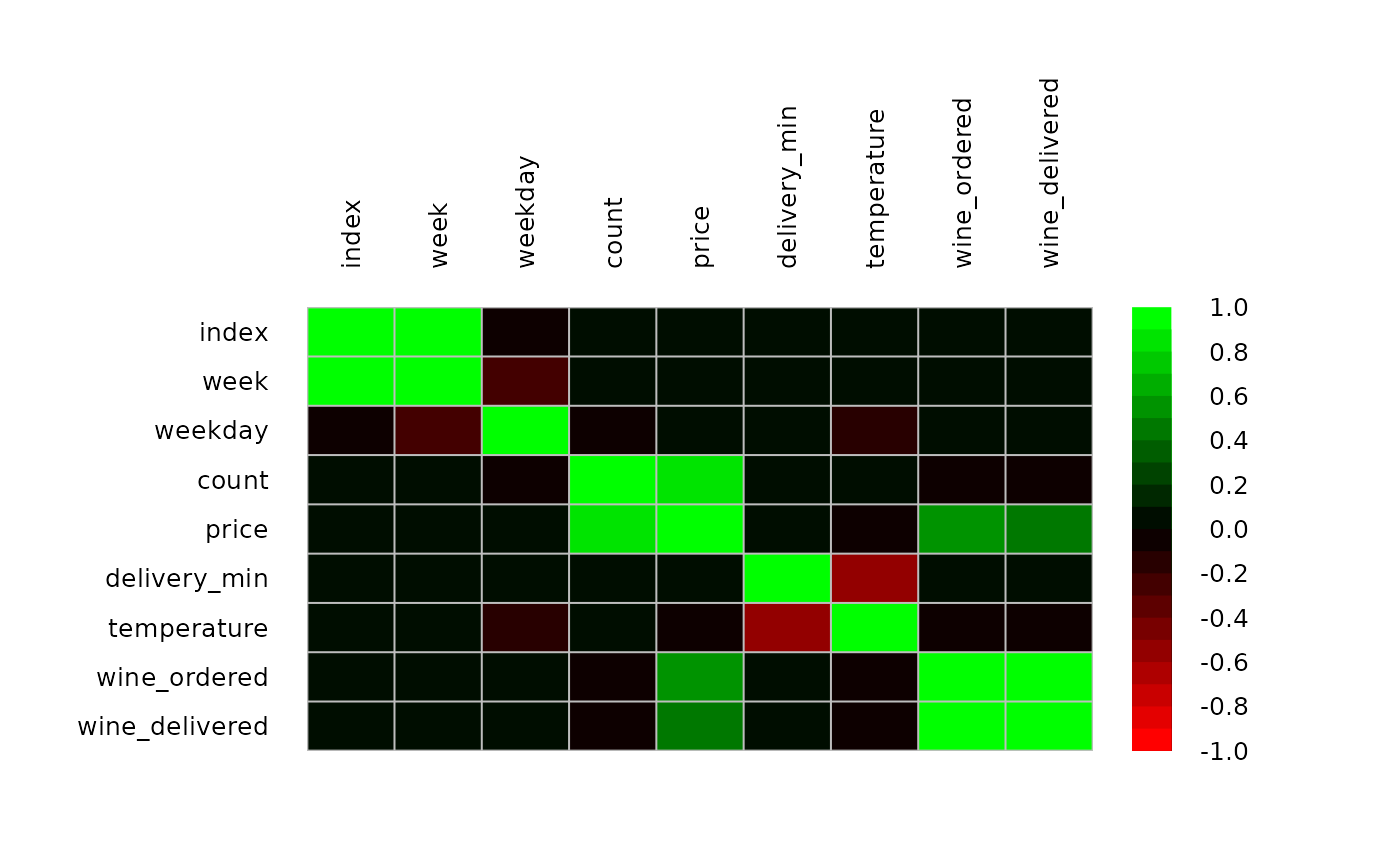 PlotCorr(m, cols=colorRampPalette(c("red", "black", "green"), space = "rgb")(20),
args.colorlegend=NA)
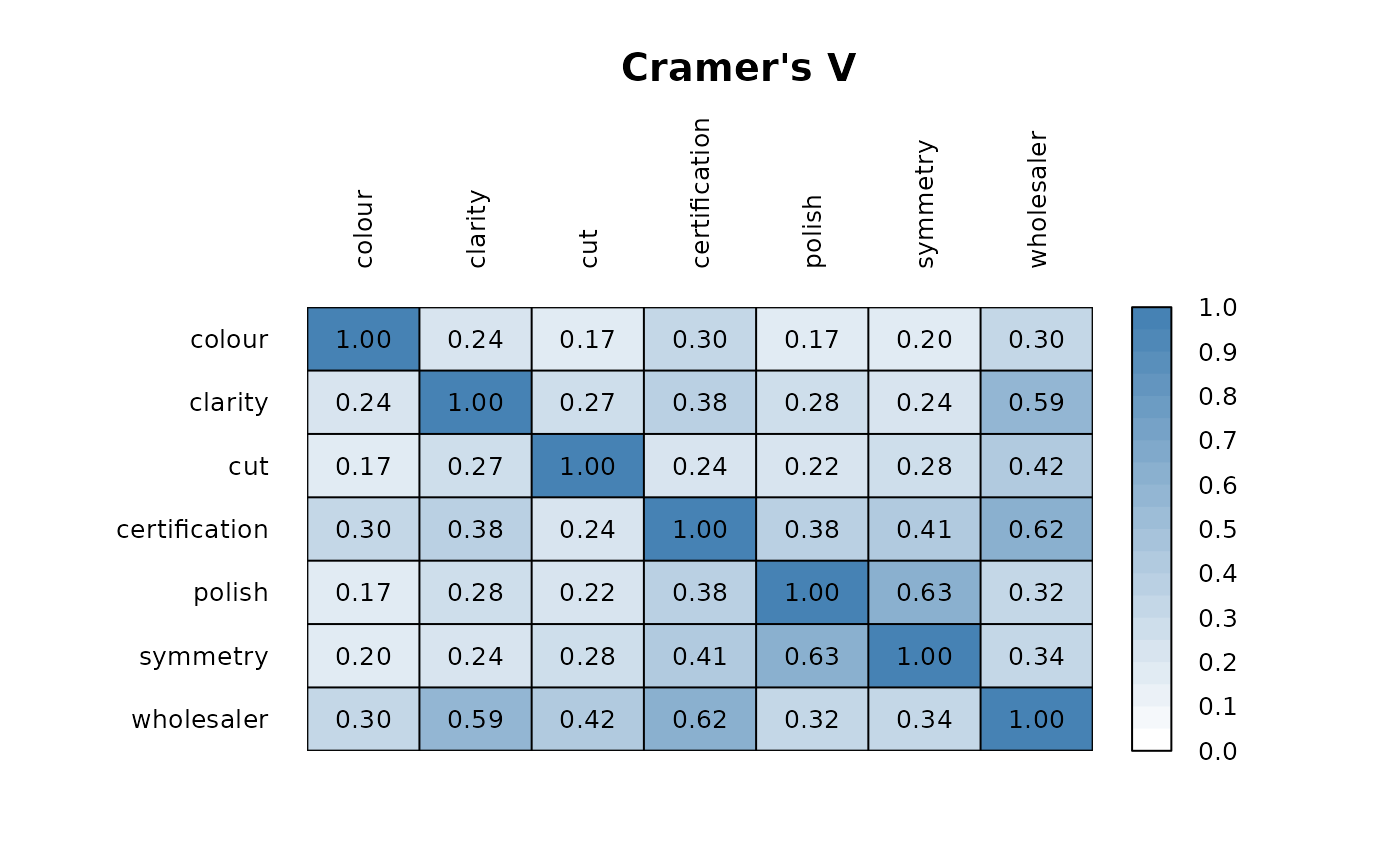
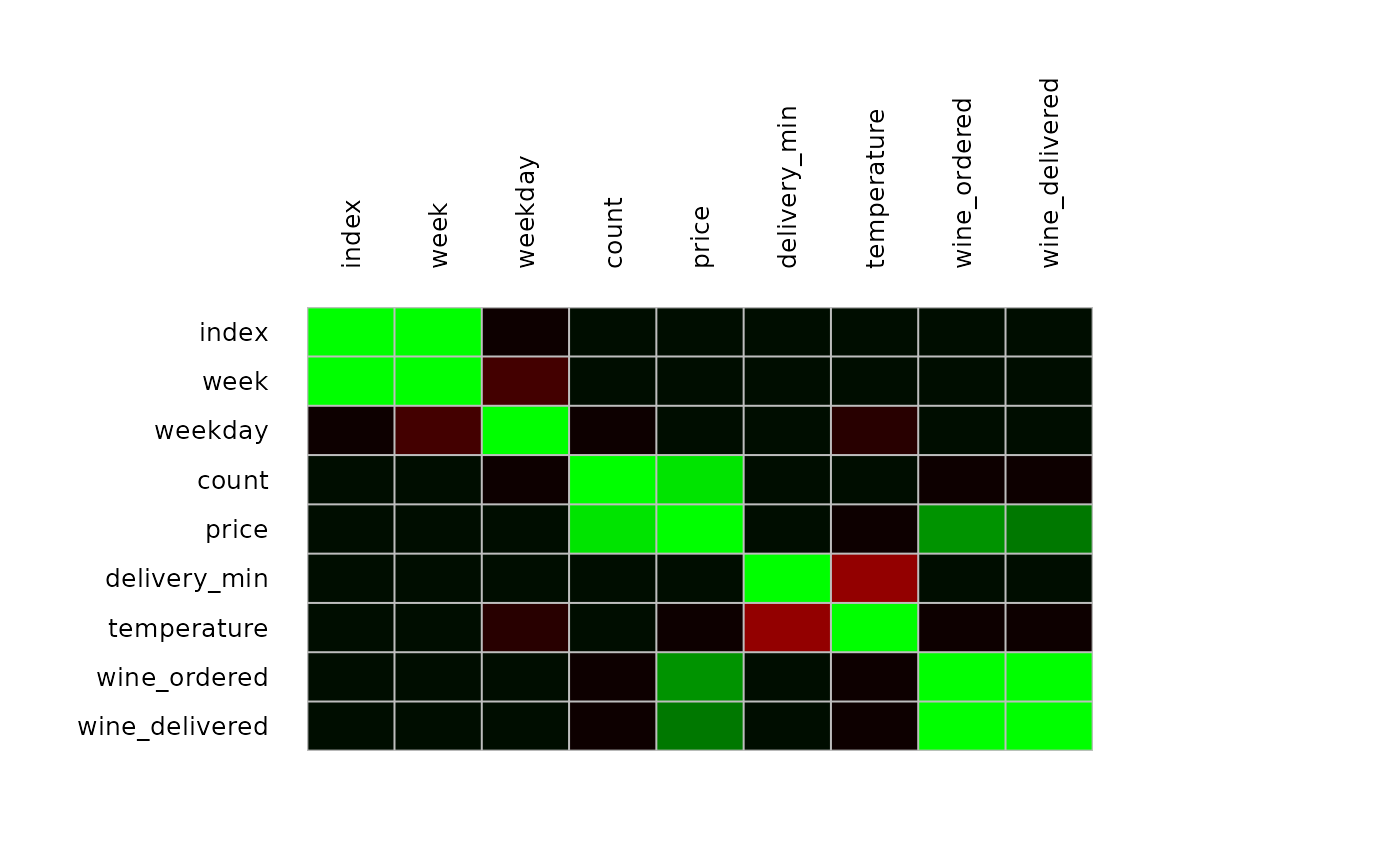 m <- PairApply(d.diamonds[, sapply(d.diamonds, is.factor)], CramerV, symmetric=TRUE)
PlotCorr(m, cols = colorRampPalette(c("white", "steelblue"), space = "rgb")(20),
breaks=seq(0, 1, length=21), border="black",
args.colorlegend = list(labels=sprintf("%.1f", seq(0, 1, length = 11)), frame=TRUE)
)
title(main="Cramer's V", line=2)
text(x=rep(1:ncol(m),ncol(m)), y=rep(1:ncol(m),each=ncol(m)),
label=sprintf("%0.2f", m[,ncol(m):1]), cex=0.8, xpd=TRUE)
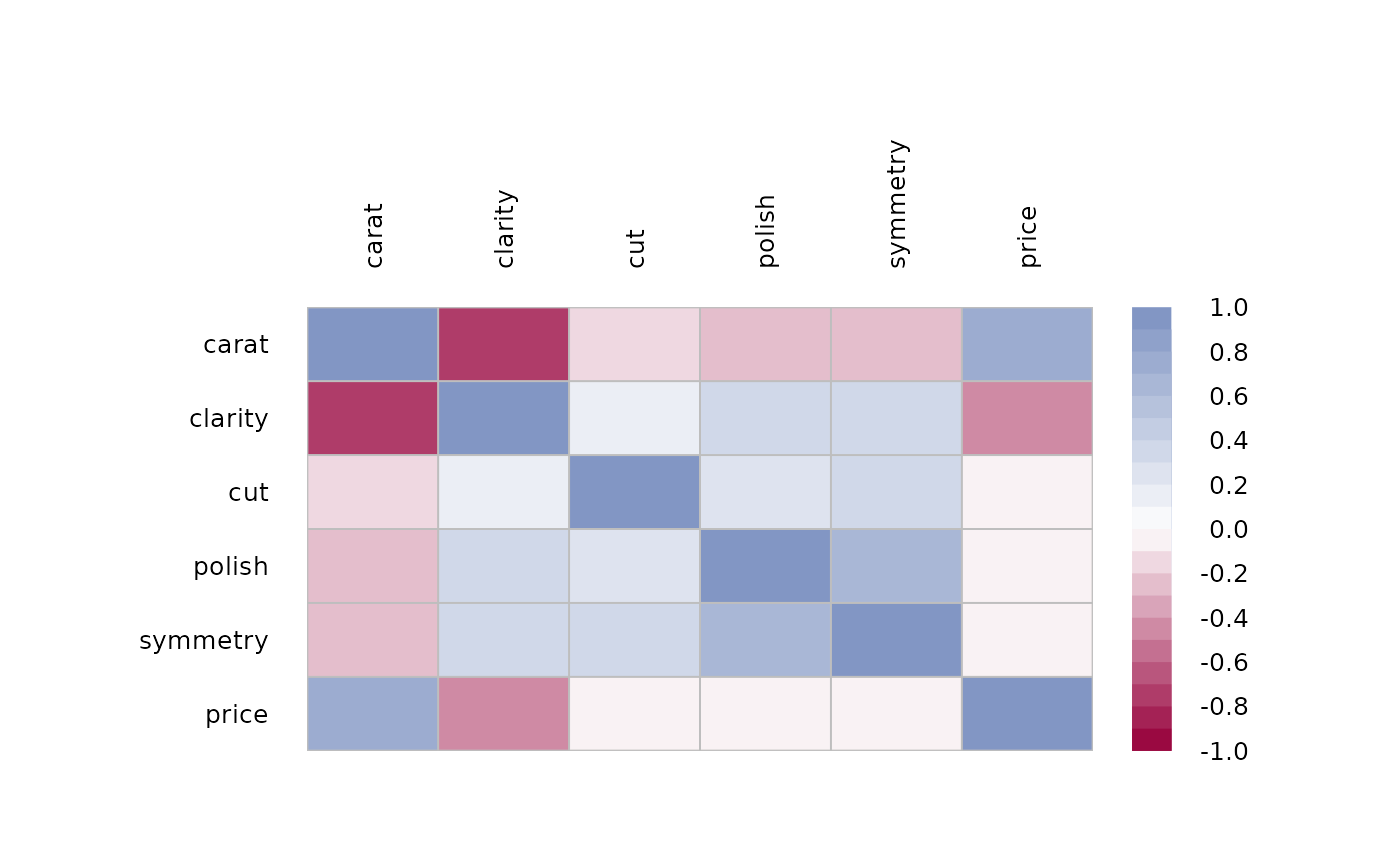
 # Spearman correlation on ordinal factors
csp <- cor(data.frame(lapply(d.diamonds[,c("carat", "clarity", "cut", "polish",
"symmetry", "price")], as.numeric)), method="spearman")
PlotCorr(csp)
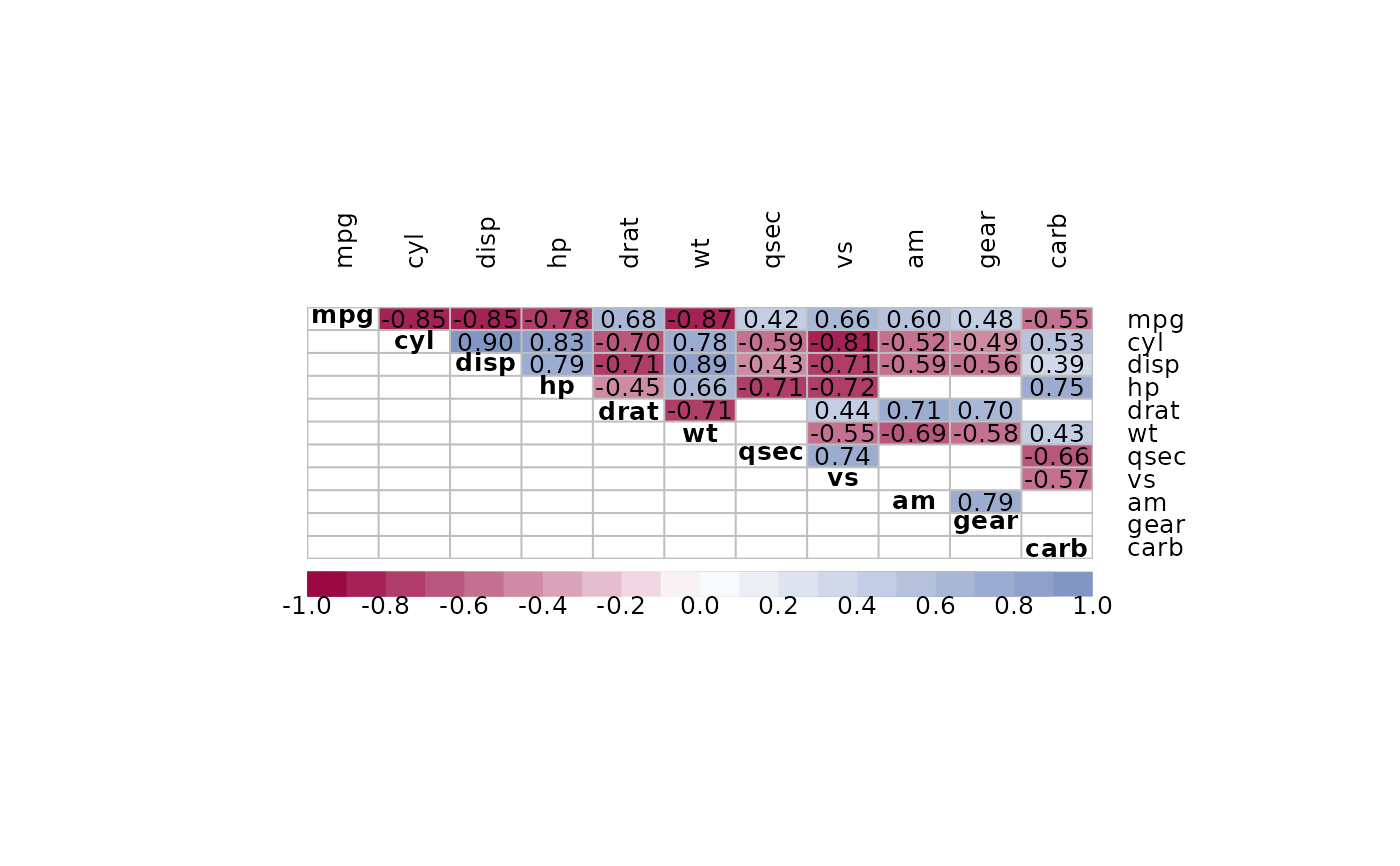
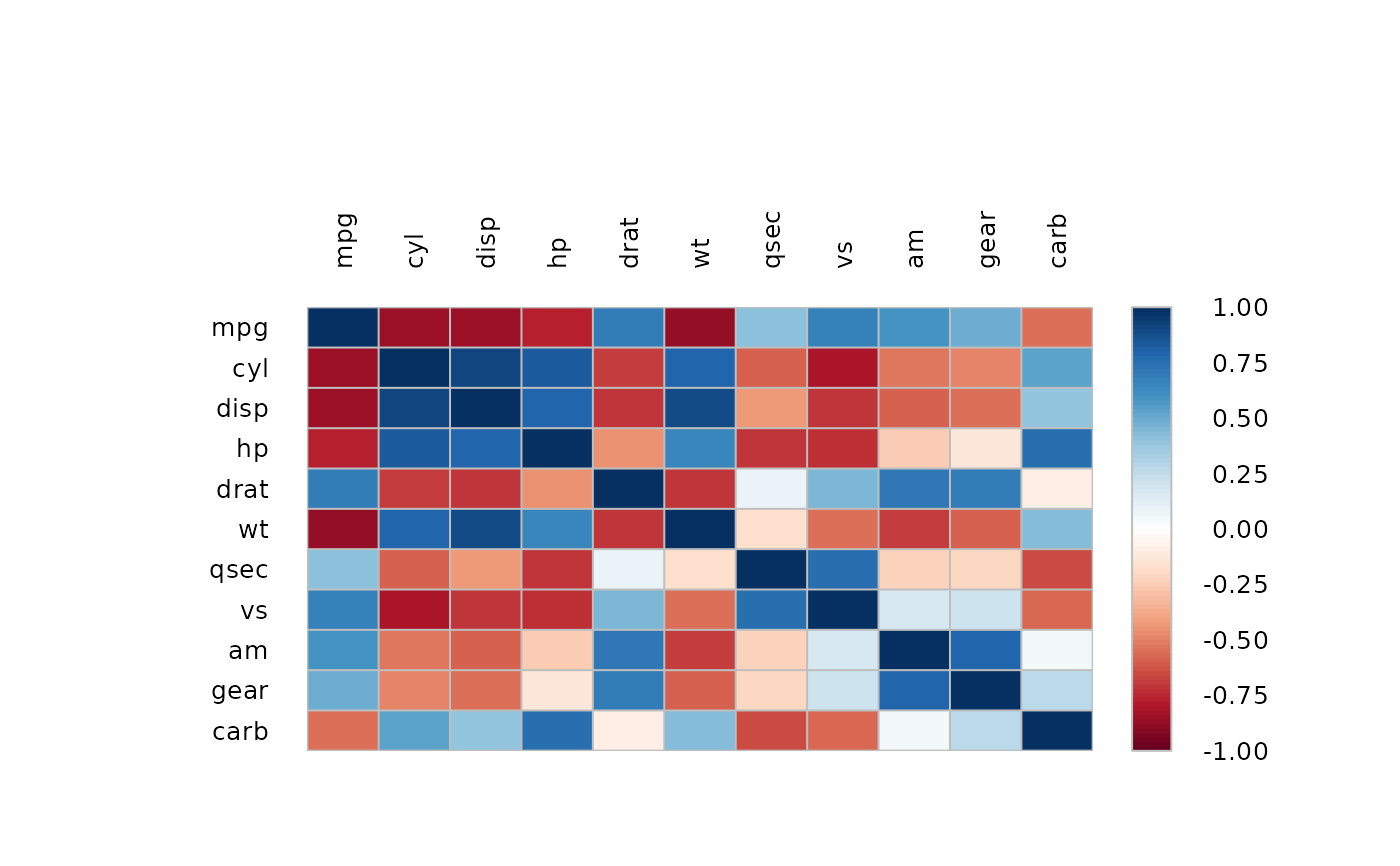
 m <- cor(mtcars)
PlotCorr(m, col=Pal("RedWhiteBlue1", 100), border="grey",
args.colorlegend=list(labels=Format(seq(-1,1,.25), digits=2), frame="grey"))
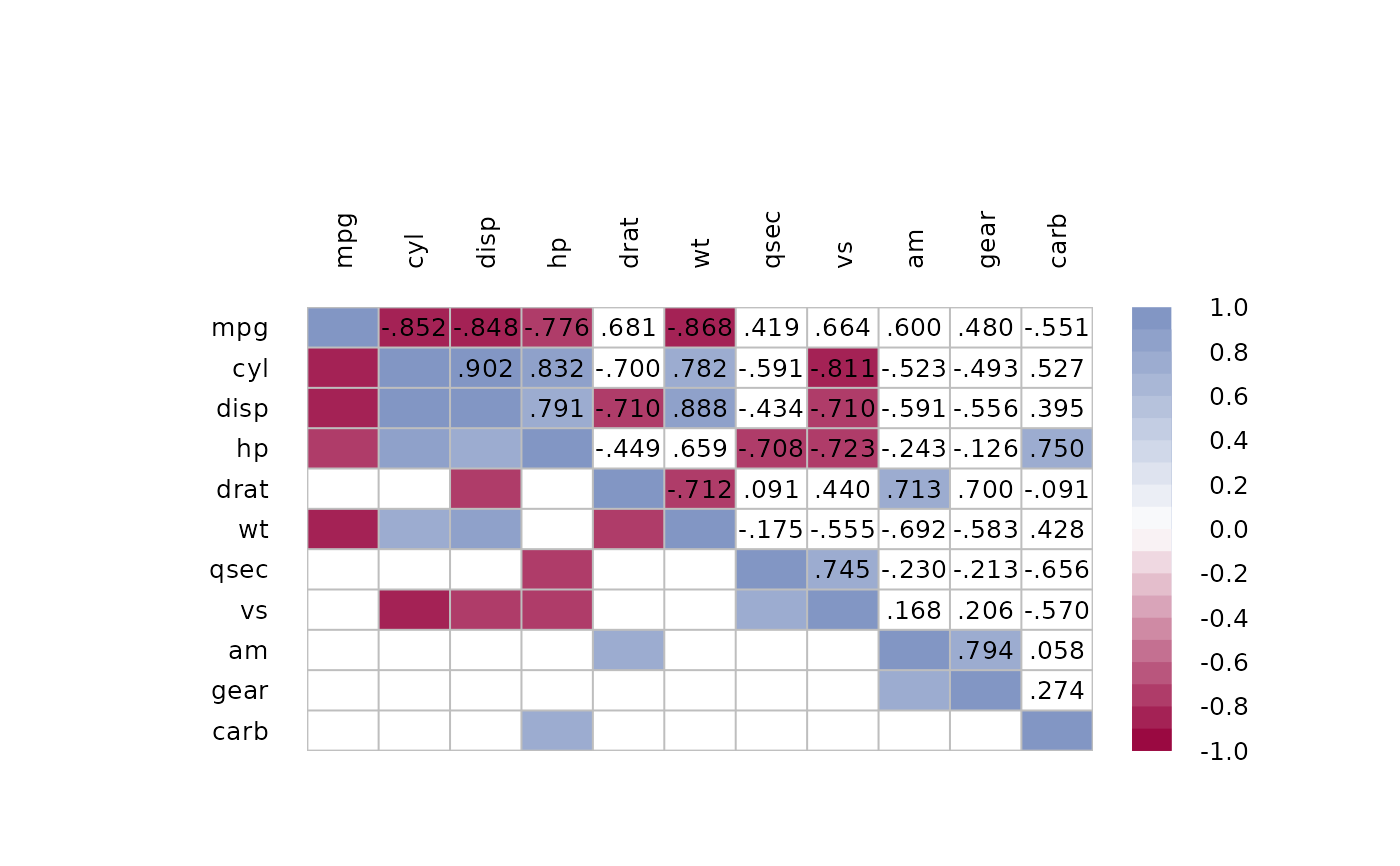
 # display only correlation with a value > 0.7
PlotCorr(m, mincor = 0.7)
x <- matrix(rep(1:ncol(m),each=ncol(m)), ncol=ncol(m))
y <- matrix(rep(ncol(m):1,ncol(m)), ncol=ncol(m))
txt <- Format(m, digits=3, ldigits=0)
idx <- upper.tri(matrix(x, ncol=ncol(m)), diag=FALSE)
# place the text on the upper triagonal matrix
text(x=x[idx], y=y[idx], label=txt[idx], cex=0.8, xpd=TRUE)
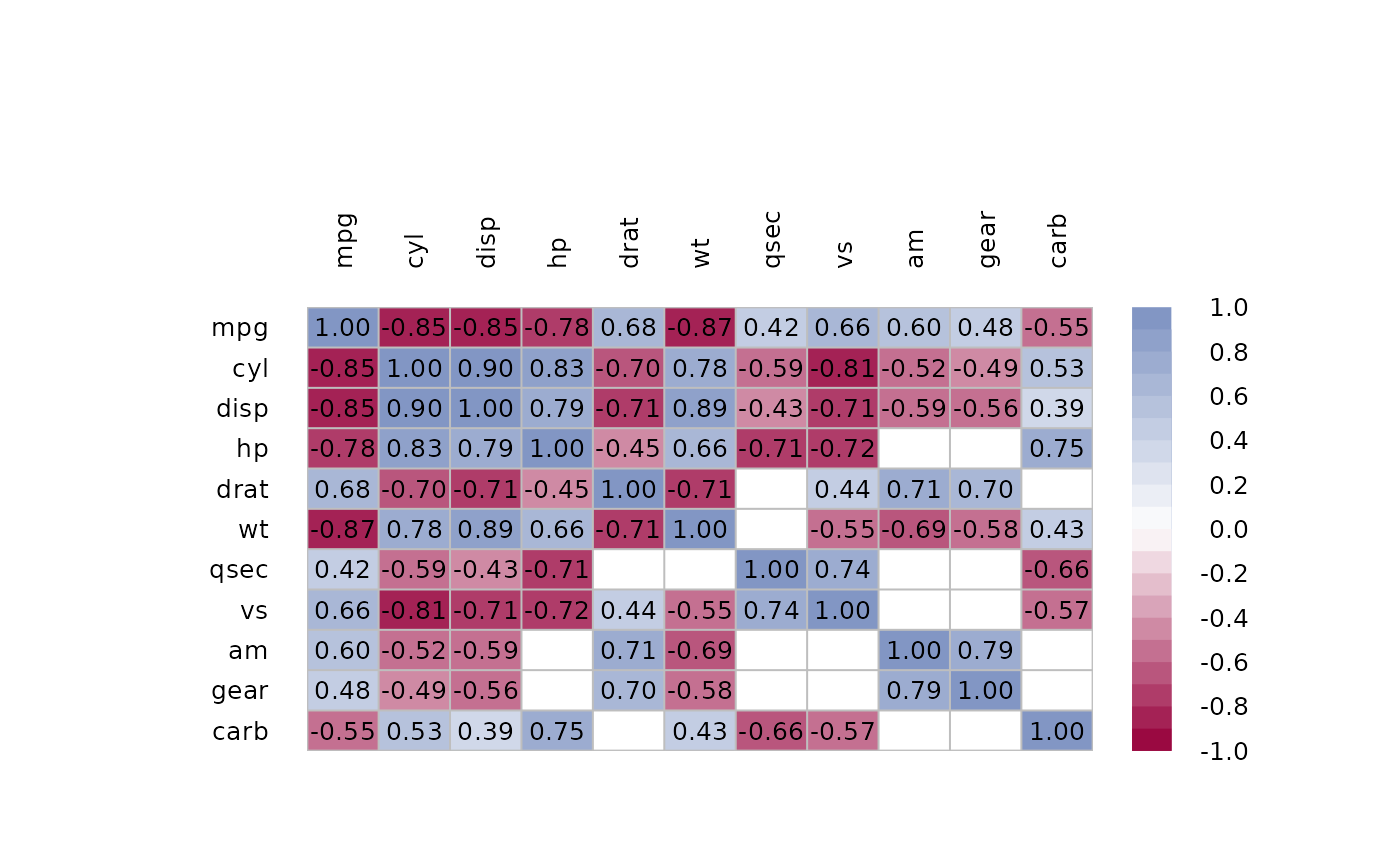
 # or let's get rid of all non significant correlations
p <- PairApply(mtcars, function(x, y) cor.test(x, y)$p.value, symmetric=TRUE)
# or somewhat more complex with outer
p0 <- outer(1:ncol(m), 1:ncol(m),
function(a, b)
mapply(
function(x, y) cor.test(mtcars[, x], mtcars[, y])$p.value,
a, b))
# ok, got all the p-values, now replace > 0.05 with NAs
m[p > 0.05] <- NA
PlotCorr(m)
# the text
n <- ncol(m)
text(x=rep(seq(n), times=n),
y=rep(rev(seq(n)), rep.int(n, n)),
labels=Format(m, digits=2, na.form=""),
cex=0.8, xpd=TRUE)
 # the text could also be set with outer, but this function returns an error,
# based on the fact that text() does not return some kind of result
# outer(X = 1:nrow(m), Y = ncol(m):1,
# FUN = "text", labels = Format(m, digits=2, na.form = ""),
# cex=0.8, xpd=TRUE)
# put similiar correlations together
PlotCorr(m, clust=TRUE)
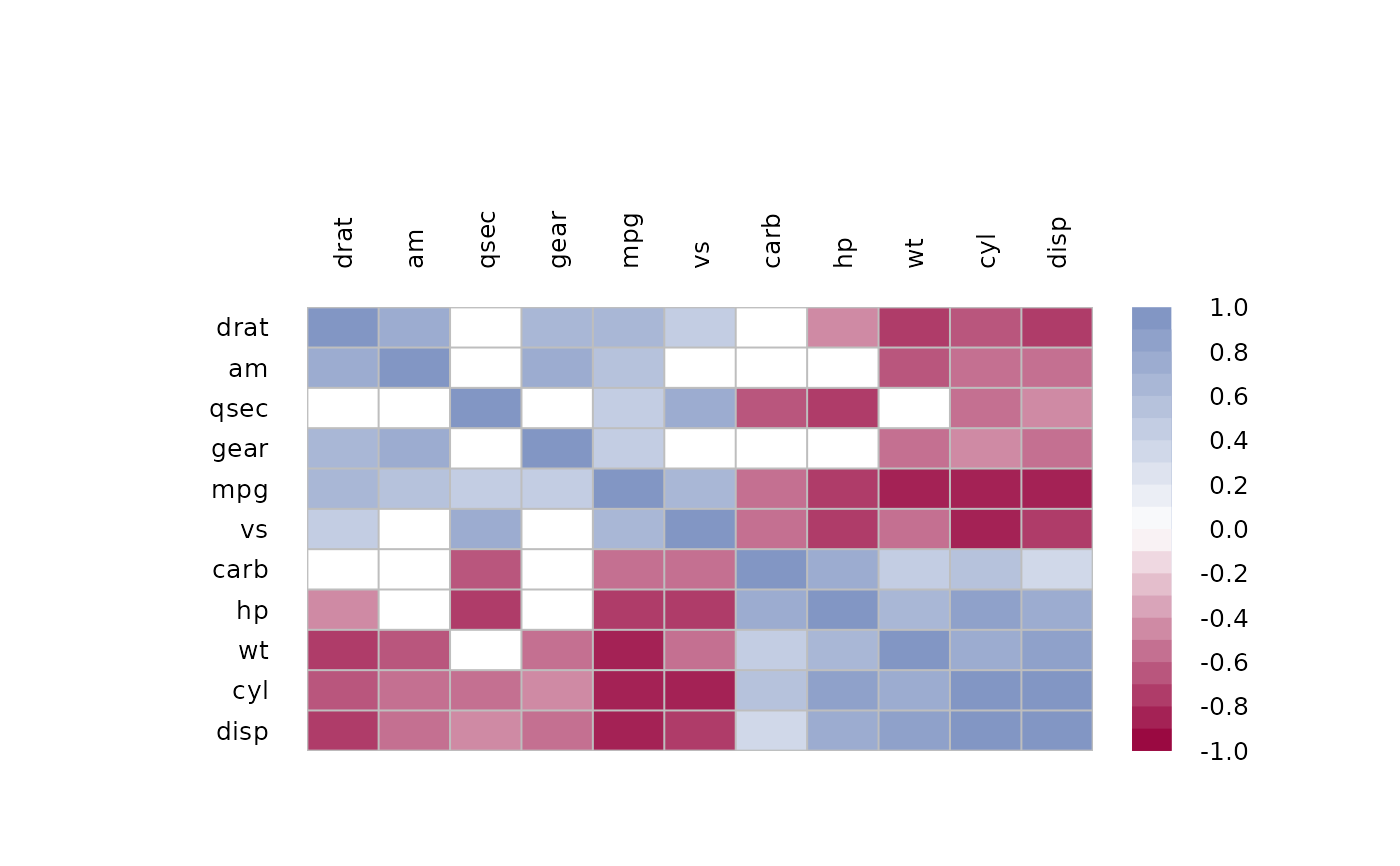 # same as
idx <- order.dendrogram(as.dendrogram(
hclust(dist(m), method = "mcquitty")
))
PlotCorr(m[idx, idx])
# plot only upper triangular matrix and move legend to bottom
m <- cor(mtcars)
m[lower.tri(m, diag=TRUE)] <- NA
p <- PairApply(mtcars, function(x, y) cor.test(x, y)$p.value, symmetric=TRUE)
m[p > 0.05] <- NA
PlotCorr(m, mar=c(8,8,8,8), yaxt="n",
args.colorlegend = list(x="bottom", inset=-.15, horiz=TRUE,
height=abs(LineToUser(line = 2.5, side = 1)),
width=ncol(m)))
mtext(text = rev(rownames(m)), side = 4, at=1:ncol(m), las=1, line = -5, cex=0.8)
text(1:ncol(m), ncol(m):1, colnames(m), xpd=NA, cex=0.8, font=2)
n <- ncol(m)
text(x=rep(seq(n), times=n),
y=rep(rev(seq(n)), rep.int(n, n)),
labels=Format(t(m), digits=2, na.form=""),
cex=0.8, xpd=TRUE)
