Create an Area Plot
PlotArea.RdProduce a stacked area plot, or add polygons to an existing plot.
# Default S3 method
PlotArea(x, y = NULL, prop = FALSE, add = FALSE, xlab = NULL,
         ylab = NULL, col = NULL, frame.plot = FALSE, ...)

# S3 method for class 'formula'
PlotArea(formula, data, subset, na.action, ...)
Arguments
- x
numeric vector of x values, or if
y=NULLa numeric vector of y values. Can also be a 1-dimensional table (x values in names, y values in array), matrix or 2-dimensional table (x values in row names and y values in columns), a data frame (x values in first column and y values in subsequent columns), or a time-series object of classts/mts.- y
numeric vector of y values, or a matrix containing y values in columns.
- prop
whether data should be plotted as proportions, so stacked areas equal 1.
- add
whether polygons should be added to an existing plot.
- xlab
label for x axis.
- ylab
label for y axis.
- col
fill color of polygon(s). The default is a vector of gray colors.
- frame.plot
a logical indicating whether a box should be drawn around the plot.
- formula
a
formula, such asy ~ xorcbind(y1, y2) ~ x, specifying x and y values. A dot on the left-hand side,formula = . ~ x, means all variables except the one specified on the right-hand side.- data
a data frame (or list) from which the variables in
formulashould be taken.- subset
an optional vector specifying a subset of observations to be used.
- na.action
a function which indicates what should happen when the data contain
NAvalues. Defaults togetOption("na.action").- ...
further arguments are passed to
matplotandpolygon.
Value
Matrix of cumulative sums that was used for plotting.
Examples
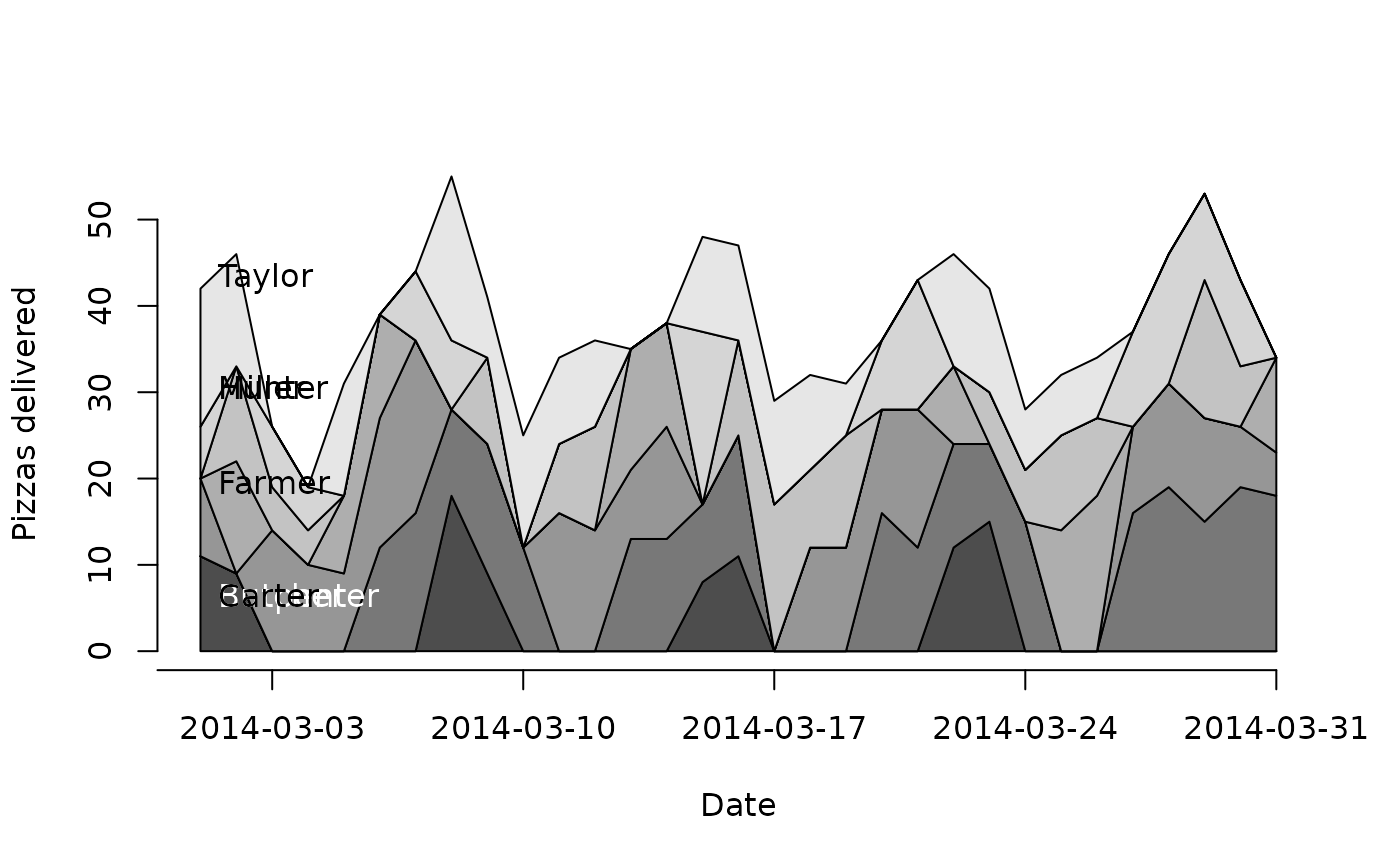
# PlotArea with stapled areas
tab <- table( d.pizza$date, d.pizza$driver )
PlotArea(x=as.Date(rownames(tab)), y=tab, xaxt="n", xlab="Date", ylab="Pizzas delivered" )
# add x-axis and some text labels
xrng <- pretty(range(as.Date(rownames(tab))))
axis(side=1, at=xrng, labels=xrng)
text( x=min(d.pizza$date + .5, na.rm=TRUE), y=cumsum(tab[2,])-2.5, label=levels(d.pizza$driver),
adj=c(0,0.5), col=TextContrastColor(gray.colors(7)))
 # formula
PlotArea(Armed.Forces~Year, data=longley)
# formula
PlotArea(Armed.Forces~Year, data=longley)
 PlotArea(cbind(Armed.Forces,Unemployed)~Year, data=longley)
 # add=TRUE
plot(1940:1970, 500*runif(31), ylim=c(0,500))
PlotArea(Armed.Forces~Year, data=longley, add=TRUE)
# add=TRUE
plot(1940:1970, 500*runif(31), ylim=c(0,500))
PlotArea(Armed.Forces~Year, data=longley, add=TRUE)
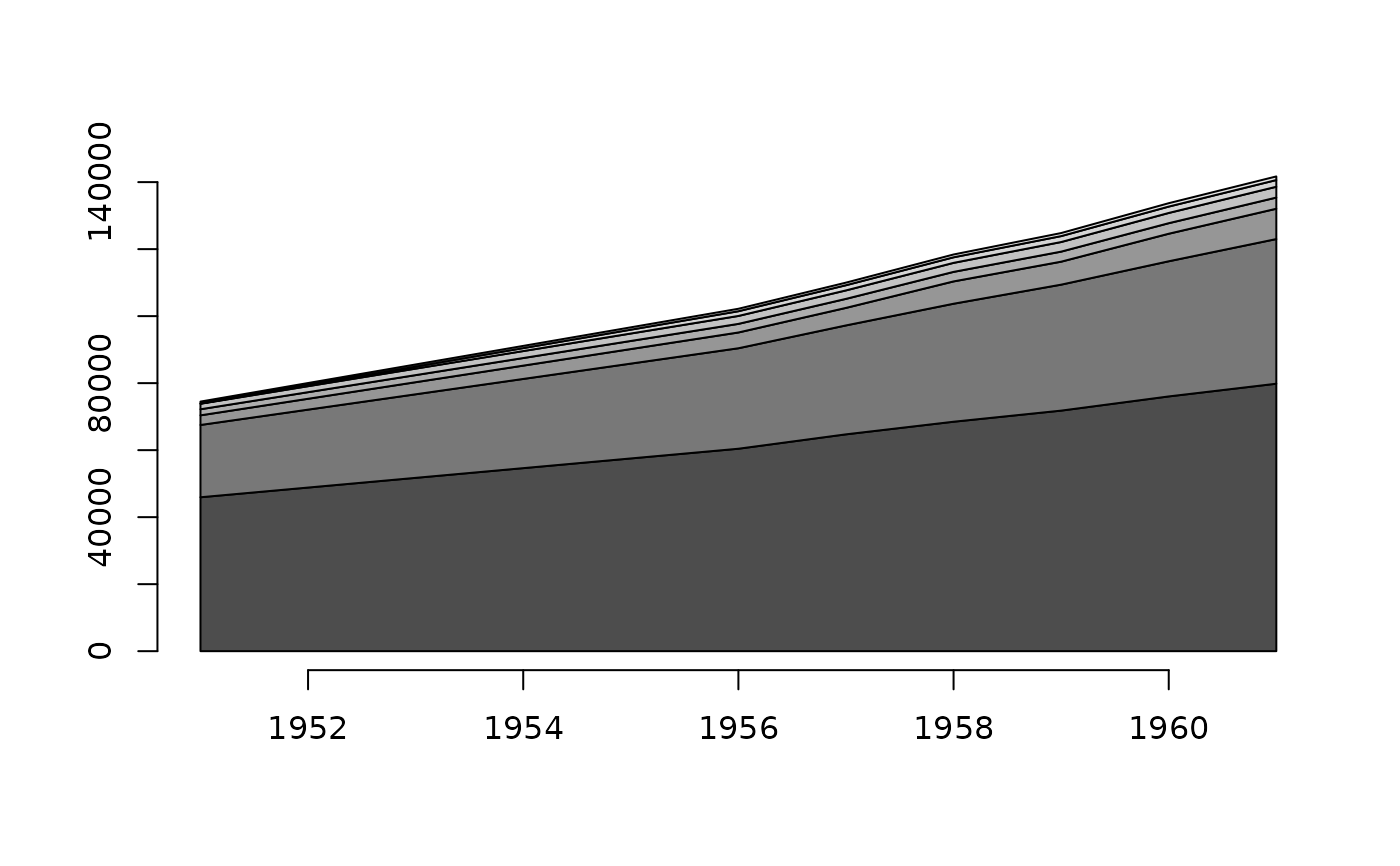
 # matrix
PlotArea(WorldPhones)
# matrix
PlotArea(WorldPhones)
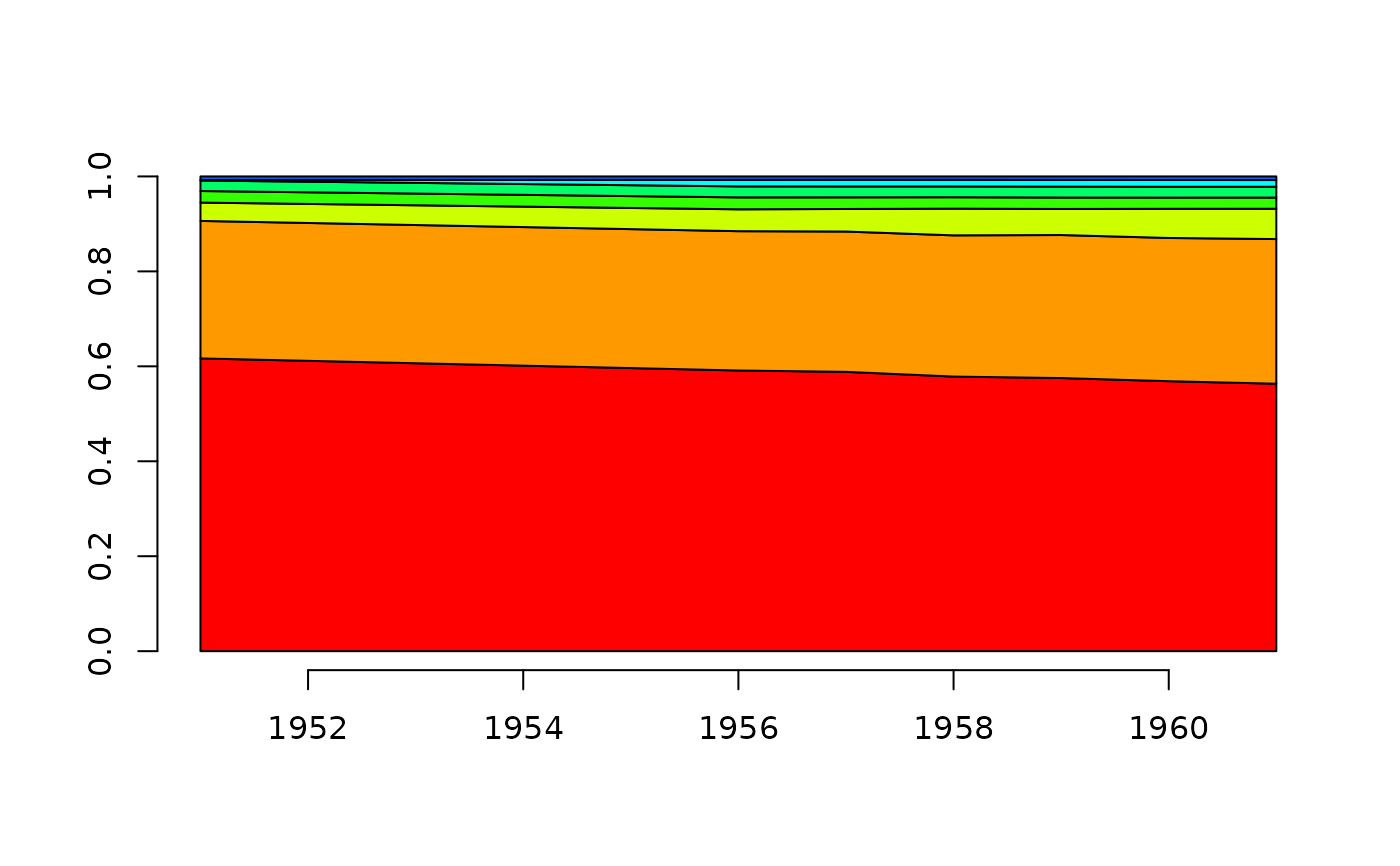
 PlotArea(WorldPhones, prop=TRUE, col=rainbow(10))
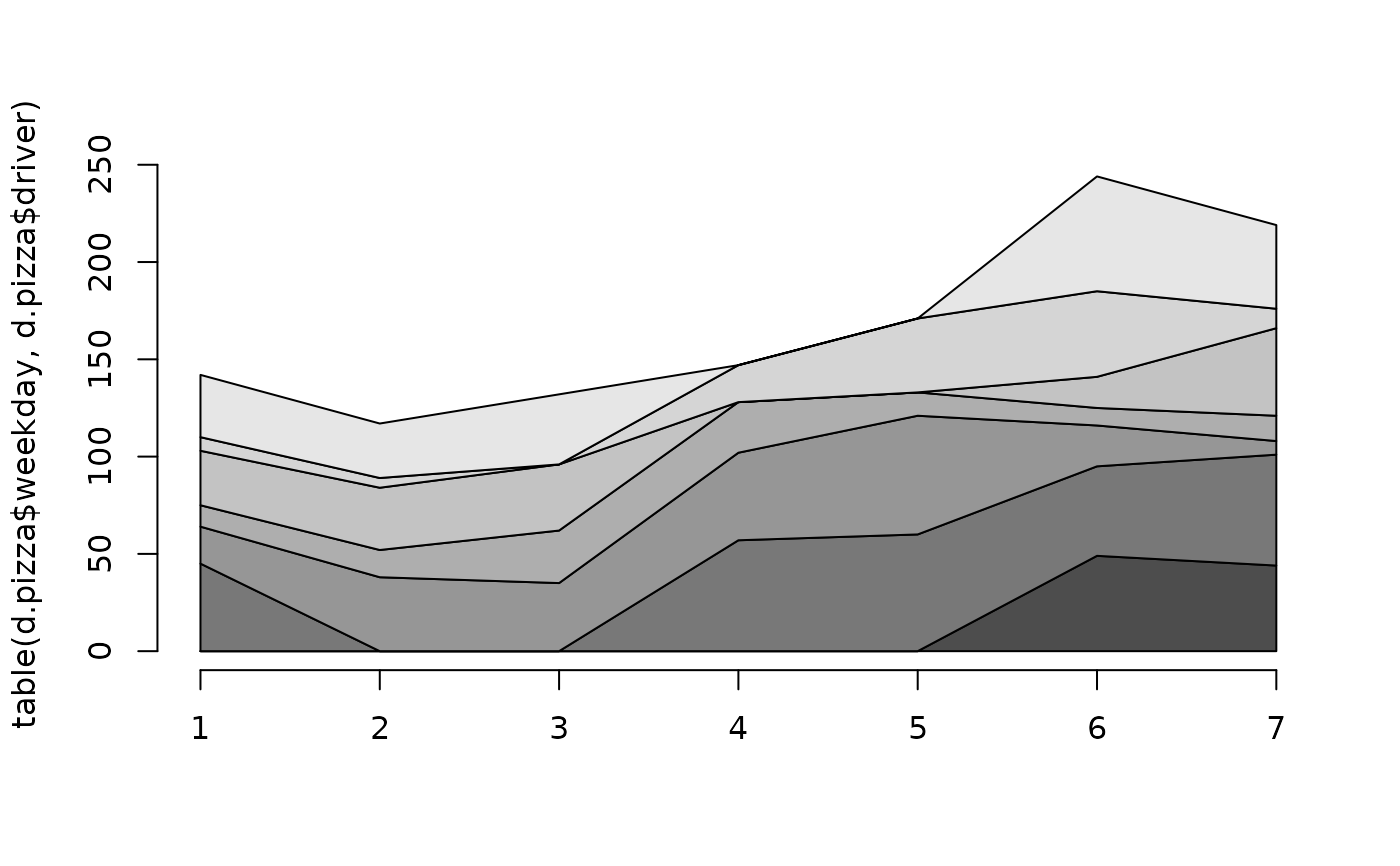
 # table
PlotArea(table(d.pizza$weekday))
# table
PlotArea(table(d.pizza$weekday))
 PlotArea(table(d.pizza$weekday, d.pizza$driver))
 # ts/mts
PlotArea(austres)
# ts/mts
PlotArea(austres)
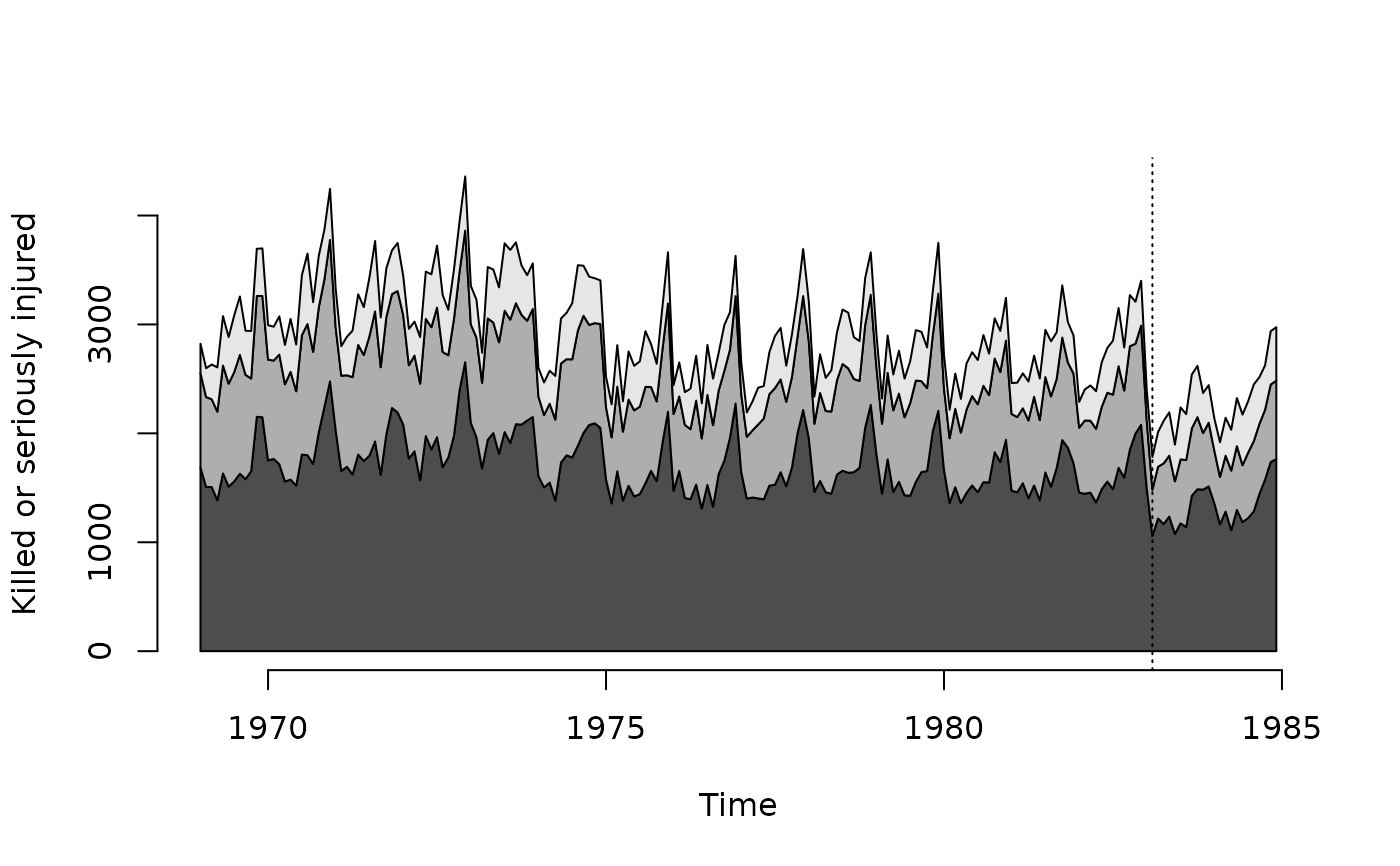
 PlotArea(Seatbelts[,c("drivers","front","rear")],
ylab="Killed or seriously injured")
abline(v=1983+1/12, lty=3)
PlotArea(Seatbelts[,c("drivers","front","rear")],
ylab="Killed or seriously injured")
abline(v=1983+1/12, lty=3)