Combined Plot of a Time Series and Its ACF and PACF
PlotACF.RdCombined plot of a time Series and its autocorrelation and partial autocorrelation
Arguments
- series
univariate time series.
- lag.max
integer. Defines the number of lags to be displayed. The default is 10 * log10(length(series)).
- main
an overall title for the plot
- cex
numerical value giving the amount by which plotting text and symbols should be magnified relative to the default.
- type
character string giving the type of acf to be computed. Allowed values are
"cor"(the default),"cov"or"part"for autocorrelation, covariance or partial correlation.- ylab
a title for the y axis: see
title.- ...
the dots are passed to the plot command.
Details
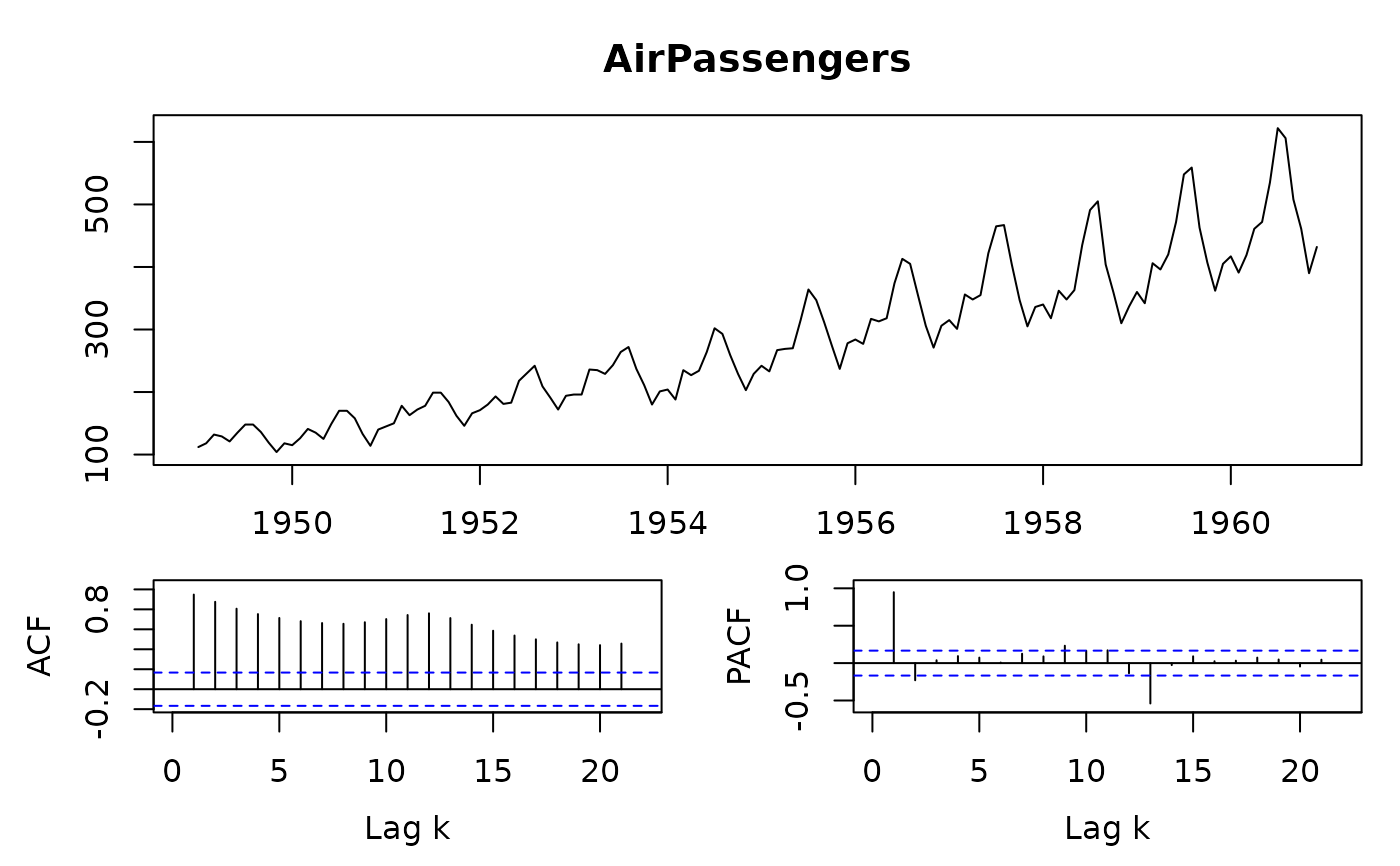
PlotACF plots a combination of the time series and its autocorrelation and partial autocorrelation. PlotGACF is used as subfunction to produce the acf- and pacf-plots.
See also
Examples
PlotACF(AirPassengers)