Draw an Ellipse
DrawEllipse.RdDraw one or several ellipses on an existing plot.
Arguments
- x, y
the x and y co-ordinates for the centre(s) of the ellipse(s).
- radius.x
a scalar or a vector giving the semi-major axis of the ellipse.
- radius.y
a scalar or a vector giving the semi-minor axis of the ellipse.
- rot
angle of rotation in radians.
- nv
number of vertices to draw the ellipses.
- border
color for borders. The default is
par("fg"). Useborder = NAto omit borders.- col
color(s) to fill or shade the annulus sector with. The default
NA(or alsoNULL) means do not fill (say draw transparent).- lty
line type for borders and shading; defaults to
"solid".- lwd
line width for borders and shading.
- plot
logical. If
TRUEthe structure will be plotted. IfFALSEonly the points are calculated and returned. Use this if you want to combine several geometric structures to a single polygon.
Details
Use DegToRad if you want to define rotation angle in degrees.
Value
The function invisibly returns a list of the calculated coordinates for all shapes.
See also
Examples
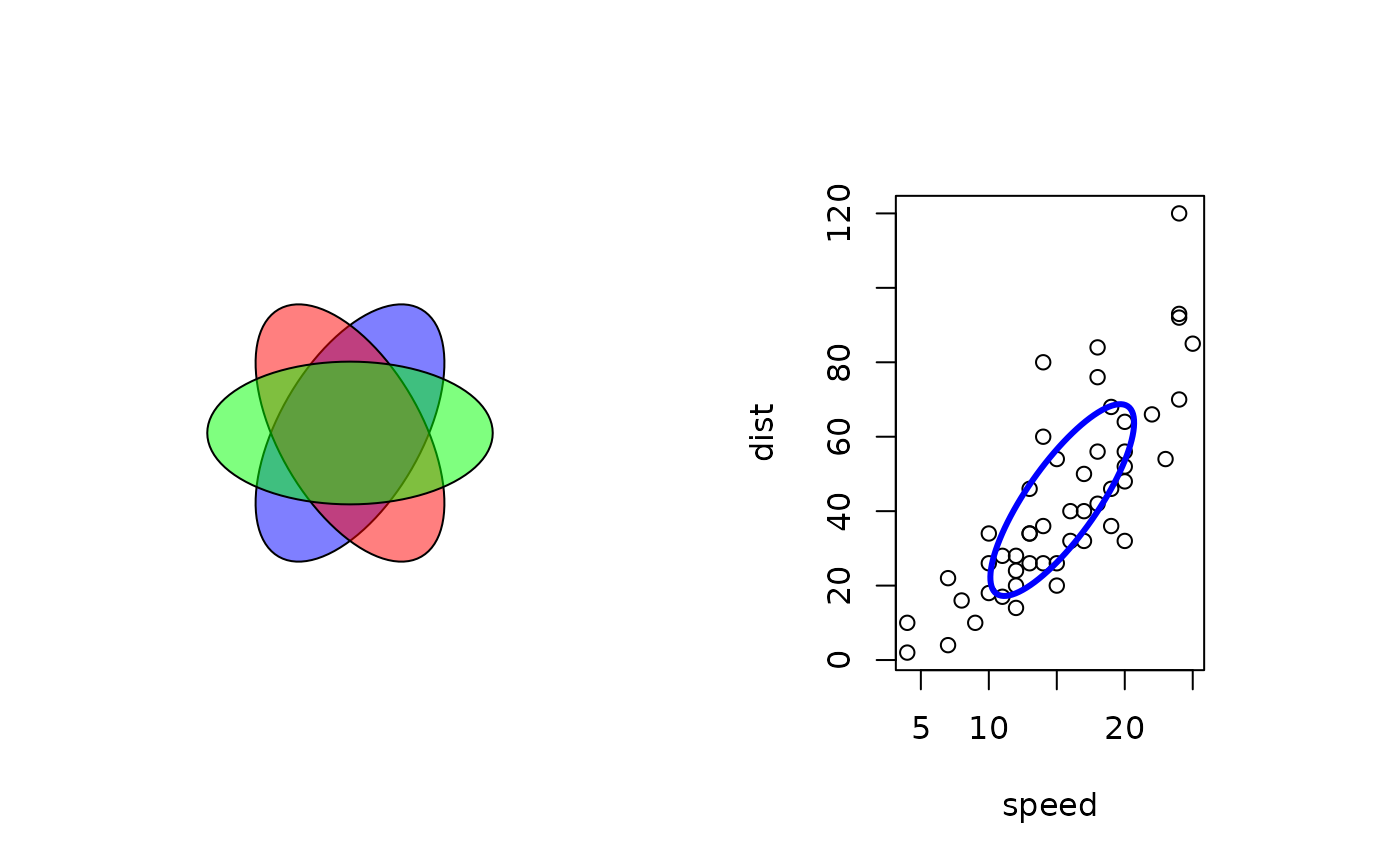
par(mfrow=c(1,2))

Canvas()
DrawEllipse(rot = c(1:3) * pi/3, col=SetAlpha(c("blue","red","green"), 0.5) )


plot(cars)
m <- var(cars)
eig <- eigen(m)
eig.val <- sqrt(eig$values)
eig.vec <- eig$vectors

DrawEllipse(x=mean(cars$speed), y=mean(cars$dist), radius.x=eig.val[1] , radius.y=eig.val[2]
  , rot=acos(eig.vec[1,1]), border="blue", lwd=3)