Convert Colors to Grey/Grayscale
ColToGrey.RdConvert colors to grey/grayscale so that you can see how your plot will look after photocopying or printing to a non-color printer.
ColToGrey(col)
ColToGray(col)
Arguments
Details
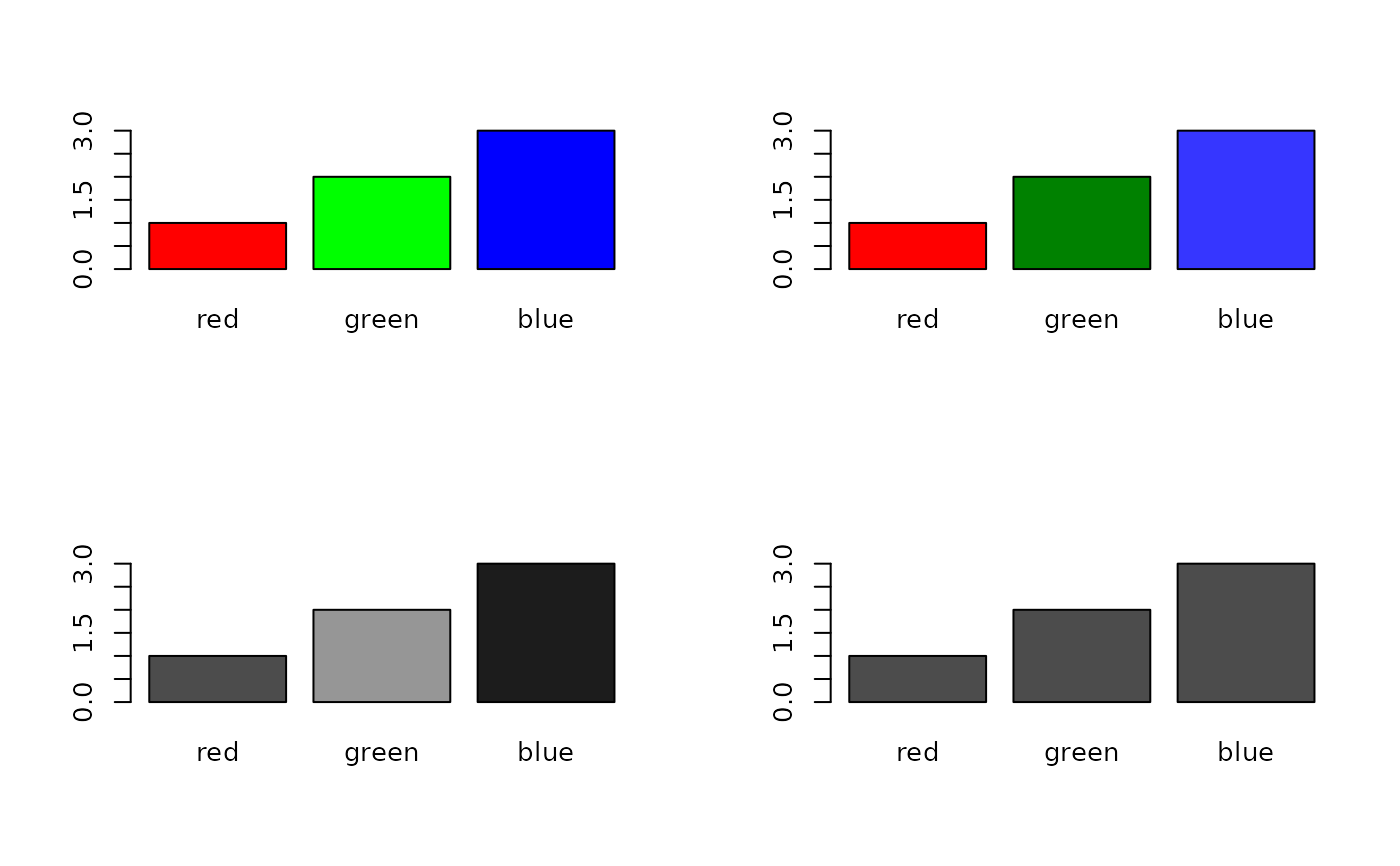
Converts colors to greyscale using the formula grey = 0.3*red + 0.59*green + 0.11*blue. This allows you to see how your color plot will approximately look when printed on a non-color printer or photocopied.
Value
A vector of colors (greys) corresponding to the input colors.
Note
These function was previously published as Col2Grey() in the TeachingDemos package and has been integrated here without logical changes.