
Dunnett's Test for Comparing Several Treatments With a Common Control
Source:R/dunnettTest.R
dunnettTest.RdPerforms Dunnett's parametric post hoc test for comparing multiple treatment groups with a control group while controlling the familywise error rate.
Usage
dunnettTest(x, ...)

# S3 method for class 'formula'
dunnettTest(formula, data, subset, na.action = na.pass, ...)

# Default S3 method
dunnettTest(x, g, control = NULL, conf.level = 0.95, ...)
Arguments
- x
a numeric vector of data values or a list of numeric vectors.
- ...
further arguments passed to or from methods.
- formula
a formula of the form
lhs ~ rhs, wherelhscontains the data values andrhsdefines the corresponding groups.- data
an optional matrix or data frame (or a similar object; see
model.frame()) containing the variables informula. By default, the variables are taken fromenvironment(formula).- subset
an optional expression specifying a subset of observations, evaluated in
data(subset = Month != 5), as inaov().- na.action
a function indicating how missing values are handled. Defaults to
na.pass(): the missing values reach the default method, which drops every observation with a missing value or a missing group, askruskal.test()does.- g
a vector or factor identifying the group of each element of
x; ignored ifxis a list.- control
a character vector identifying one or more control levels. Each specified control is compared separately with all remaining groups. Defaults to the first group.
- conf.level
the confidence level for the simultaneous confidence intervals. Defaults to
0.95.
Value
An object of class "PostHocTest": a list containing one
matrix for each control level. Each matrix has columns diff for
the observed mean difference (treatment minus control), lci
and uci for the simultaneous confidence limits, and
p.value for the multiplicity-adjusted p-value.
Print and plot methods are available for class "PostHocTest".
The plot method supplies its own axis labels and title and therefore does
not accept xlab, ylab, or main.
Details
If x is a list, its elements are taken as the samples to be
compared and must therefore be numeric vectors. In this case, g
is ignored. The test can be performed with dunnettTest(x) or,
if the samples are stored in separate objects, with
dunnettTest(list(x, ...)).
Otherwise, x must be a numeric vector and g a vector or
factor of the same length that identifies the group of each observation.
The adjusted p-values and simultaneous confidence intervals are
two-sided. The confidence limits use the equicoordinate quantile of
\(\max_j |T_j|\) (tail = "both.tails" in
mvtnorm::qmvt()), in accordance with the adjusted p-values
\(1 - P(\max_j |T_j| \le |t_i|)\). Multivariate t probabilities are
evaluated by randomized quasi-Monte Carlo integration using
mvtnorm. A fixed seed ensures that repeated calls produce identical
results up to the numerical integration accuracy.
References
Dunnett, C. W. (1955). A multiple comparison procedure for comparing several treatments with a control. Journal of the American Statistical Association, 50, 1096–1121.
Examples
## Hollander and Wolfe (1973, p. 116)
## Mucociliary efficiency from the rate of removal of dust in normal
## subjects, subjects with obstructive airway disease, and subjects
## with asbestosis.
x <- c(2.9, 3.0, 2.5, 2.6, 3.2) # normal subjects
y <- c(3.8, 2.7, 4.0, 2.4) # with obstructive airway disease
z <- c(2.8, 3.4, 3.7, 2.2, 2.0) # with asbestosis
dunnettTest(list(x, y, z))
#>
#> Dunnett's test for comparing several treatments with a control : Dunnett
#> 95% family-wise confidence level
#>
#> $`1`
#> diff lci uci p.value signif
#> 2-1 0.385 -0.6898153 1.4598153 0.583
#> 3-1 -0.020 -1.0333456 0.9933456 0.998
#>
#> ---
#> Signif. codes: 0 '***' 0.001 '**' 0.01 '*' 0.05 '.' 0.1 ' ' 1
#>
## Equivalent vector-and-group interface
x <- c(x, y, z)
g <- factor(rep(1:3, c(5, 4, 5)),
labels = c("Normal subjects",
"Subjects with obstructive airway disease",
"Subjects with asbestosis"))
dunnettTest(x, g)
#>
#> Dunnett's test for comparing several treatments with a control : Dunnett
#> 95% family-wise confidence level
#>
#> $`Normal subjects`
#> diff lci
#> Subjects with obstructive airway disease-Normal subjects 0.385 -0.6898153
#> Subjects with asbestosis-Normal subjects -0.020 -1.0333456
#> uci p.value
#> Subjects with obstructive airway disease-Normal subjects 1.4598153 0.583
#> Subjects with asbestosis-Normal subjects 0.9933456 0.998
#> signif
#> Subjects with obstructive airway disease-Normal subjects
#> Subjects with asbestosis-Normal subjects
#>
#> ---
#> Signif. codes: 0 '***' 0.001 '**' 0.01 '*' 0.05 '.' 0.1 ' ' 1
#>
## Formula interface
boxplot(Ozone ~ factor(Month), data = airquality)
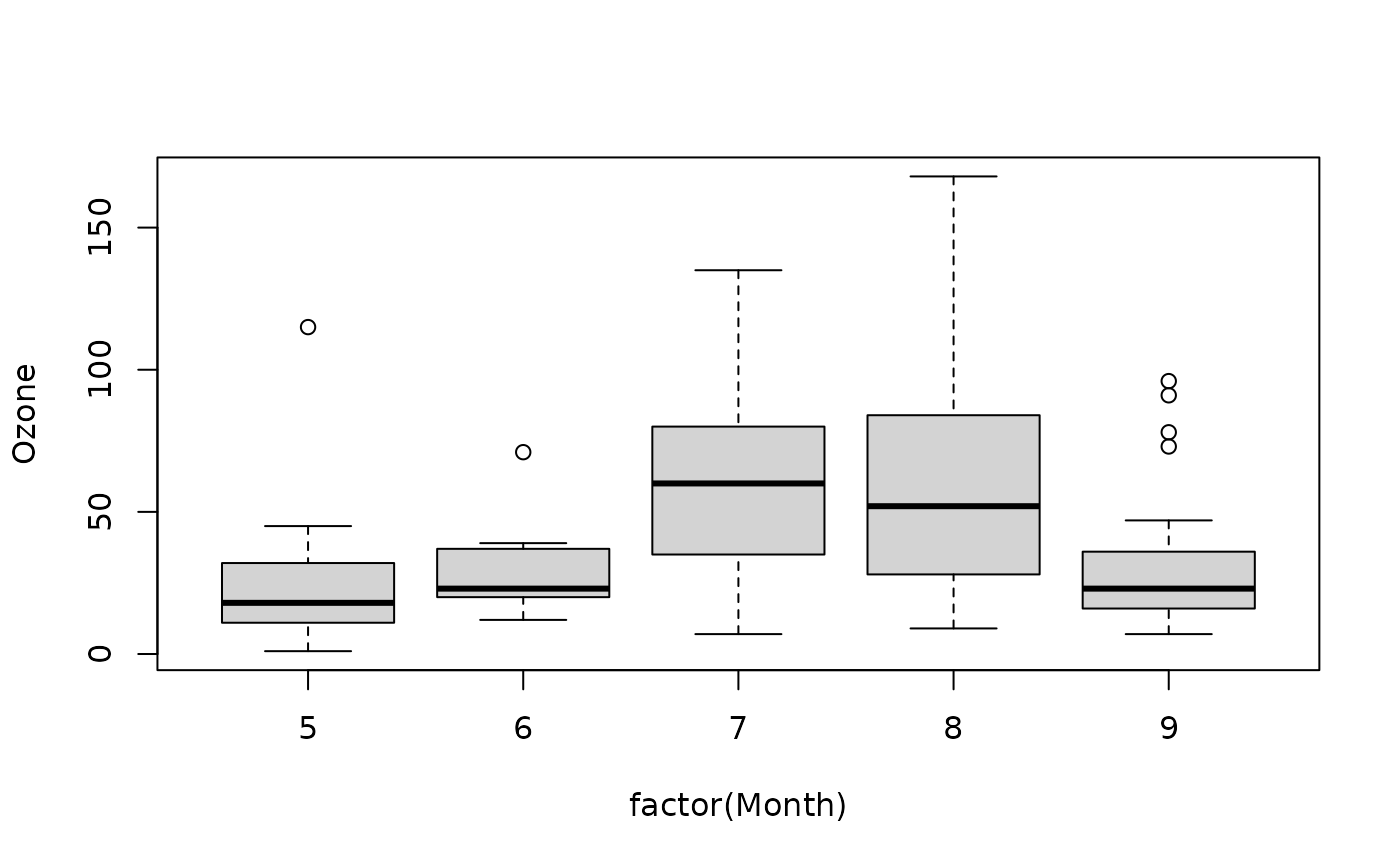 dunnettTest(Ozone ~ factor(Month), data = airquality)
#>
#> Dunnett's test for comparing several treatments with a control : Dunnett
#> 95% family-wise confidence level
#>
#> $`5`
#> diff lci uci p.value signif
#> 6-5 5.829060 -22.43036 34.08848 0.965
#> 7-5 35.500000 15.23412 55.76588 < 0.001 ***
#> 8-5 36.346154 16.08027 56.61204 < 0.001 ***
#> 9-5 7.832891 -11.90191 27.56770 0.735
#>
#> ---
#> Signif. codes: 0 '***' 0.001 '**' 0.01 '*' 0.05 '.' 0.1 ' ' 1
#>
## Single control level with a 90% simultaneous confidence level
dunnettTest(Ozone ~ factor(Month), data = airquality,
control = "8", conf.level = 0.9)
#>
#> Dunnett's test for comparing several treatments with a control : Dunnett
#> 90% family-wise confidence level
#>
#> $`8`
#> diff lci uci p.value signif
#> 5-8 -36.3461538 -54.26325 -18.429061 < 0.001 ***
#> 6-8 -30.5170940 -55.50129 -5.532901 0.030 *
#> 7-8 -0.8461538 -18.76325 17.070939 1.000
#> 9-8 -28.5132626 -45.96083 -11.065695 0.002 **
#>
#> ---
#> Signif. codes: 0 '***' 0.001 '**' 0.01 '*' 0.05 '.' 0.1 ' ' 1
#>
## Multiple control levels
dunnettTest(Ozone ~ factor(Month), data = airquality,
control = c("5", "8"))
#>
#> Dunnett's test for comparing several treatments with a control : Dunnett
#> 95% family-wise confidence level
#>
#> $`5`
#> diff lci uci p.value signif
#> 6-5 5.829060 -22.43036 34.08848 0.965
#> 7-5 35.500000 15.23412 55.76588 < 0.001 ***
#> 8-5 36.346154 16.08027 56.61204 < 0.001 ***
#> 9-5 7.832891 -11.90191 27.56770 0.735
#>
#> $`8`
#> diff lci uci p.value signif
#> 5-8 -36.3461538 -56.61204 -16.080272 < 0.001 ***
#> 6-8 -30.5170940 -58.77652 -2.257672 0.030 *
#> 7-8 -0.8461538 -21.11204 19.419728 1.000
#> 9-8 -28.5132626 -48.24807 -8.778457 0.002 **
#>
#> ---
#> Signif. codes: 0 '***' 0.001 '**' 0.01 '*' 0.05 '.' 0.1 ' ' 1
#>
dunnettTest(Ozone ~ factor(Month), data = airquality)
#>
#> Dunnett's test for comparing several treatments with a control : Dunnett
#> 95% family-wise confidence level
#>
#> $`5`
#> diff lci uci p.value signif
#> 6-5 5.829060 -22.43036 34.08848 0.965
#> 7-5 35.500000 15.23412 55.76588 < 0.001 ***
#> 8-5 36.346154 16.08027 56.61204 < 0.001 ***
#> 9-5 7.832891 -11.90191 27.56770 0.735
#>
#> ---
#> Signif. codes: 0 '***' 0.001 '**' 0.01 '*' 0.05 '.' 0.1 ' ' 1
#>
## Single control level with a 90% simultaneous confidence level
dunnettTest(Ozone ~ factor(Month), data = airquality,
control = "8", conf.level = 0.9)
#>
#> Dunnett's test for comparing several treatments with a control : Dunnett
#> 90% family-wise confidence level
#>
#> $`8`
#> diff lci uci p.value signif
#> 5-8 -36.3461538 -54.26325 -18.429061 < 0.001 ***
#> 6-8 -30.5170940 -55.50129 -5.532901 0.030 *
#> 7-8 -0.8461538 -18.76325 17.070939 1.000
#> 9-8 -28.5132626 -45.96083 -11.065695 0.002 **
#>
#> ---
#> Signif. codes: 0 '***' 0.001 '**' 0.01 '*' 0.05 '.' 0.1 ' ' 1
#>
## Multiple control levels
dunnettTest(Ozone ~ factor(Month), data = airquality,
control = c("5", "8"))
#>
#> Dunnett's test for comparing several treatments with a control : Dunnett
#> 95% family-wise confidence level
#>
#> $`5`
#> diff lci uci p.value signif
#> 6-5 5.829060 -22.43036 34.08848 0.965
#> 7-5 35.500000 15.23412 55.76588 < 0.001 ***
#> 8-5 36.346154 16.08027 56.61204 < 0.001 ***
#> 9-5 7.832891 -11.90191 27.56770 0.735
#>
#> $`8`
#> diff lci uci p.value signif
#> 5-8 -36.3461538 -56.61204 -16.080272 < 0.001 ***
#> 6-8 -30.5170940 -58.77652 -2.257672 0.030 *
#> 7-8 -0.8461538 -21.11204 19.419728 1.000
#> 9-8 -28.5132626 -48.24807 -8.778457 0.002 **
#>
#> ---
#> Signif. codes: 0 '***' 0.001 '**' 0.01 '*' 0.05 '.' 0.1 ' ' 1
#>