Compute Axis Tickmark Locations (For POSIXct Axis)
axTicks.POSIXct.RdCompute pretty tickmark locations, the same way as R does internally. By default, gives the at values which axis.POSIXct(side, x) would use.
axTicks.POSIXct(side, x, at, format, labels = TRUE, ...)

axTicks.Date(side = 1, x, ...)
Arguments
- side
See axis.
- x, at
A date-time or date object.
- format
See strptime.
- labels
Either a logical value specifying whether annotations are to be made at the tickmarks, or a vector of character strings to be placed at the tickpoints.
- ...
Further arguments to be passed from or to other methods.
Details
axTicks has no implementation for POSIXct axis. This function fills the gap.
Value
numeric vector of coordinate values at which axis tickmarks can be drawn.
See also
Examples
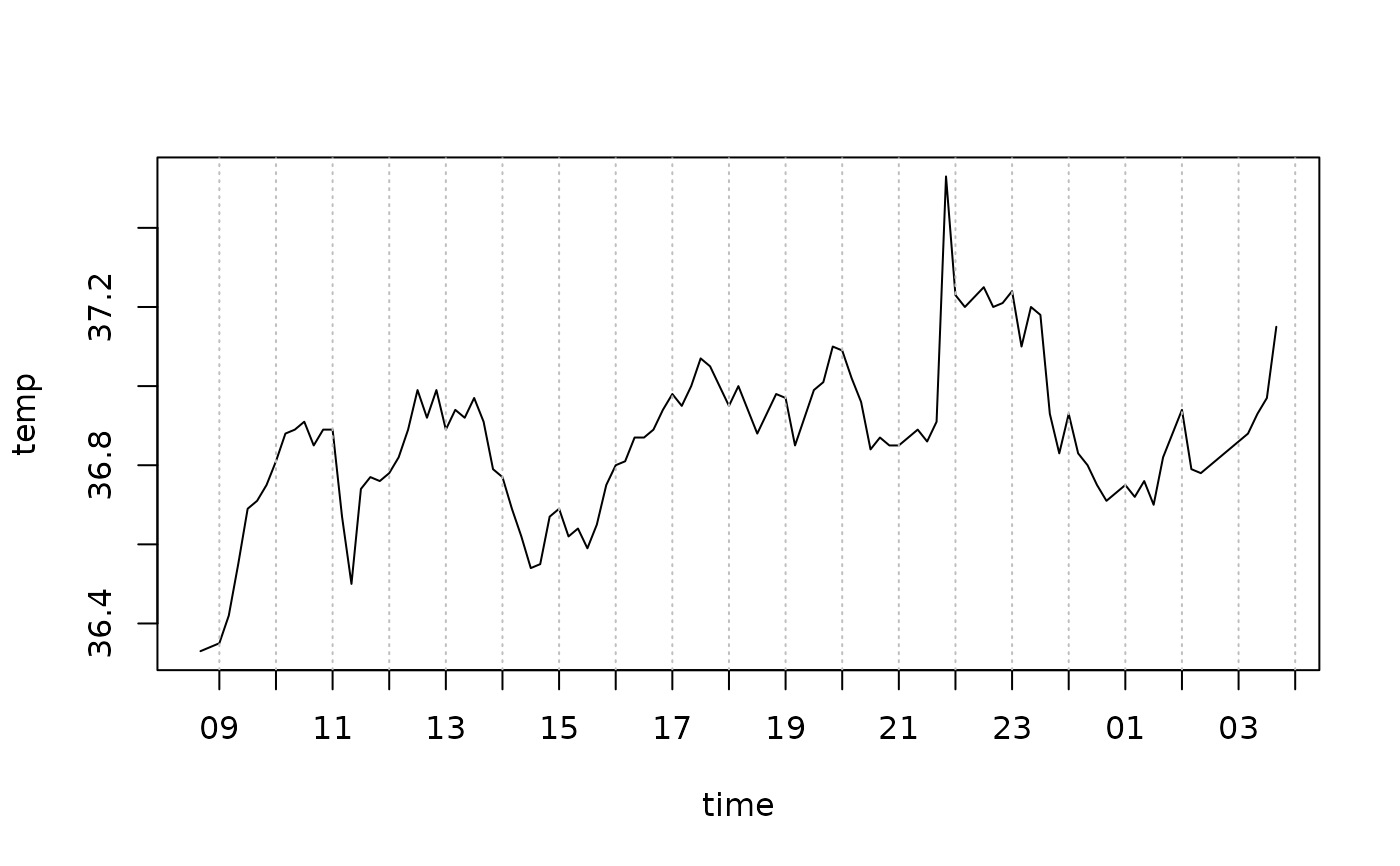
with(beaver1, {
  time <- strptime(paste(1990, day, time %/% 100, time %% 100),
                   "%Y %j %H %M")
  plot(time, temp, type = "l") # axis at 4-hour intervals.
  # now label every hour on the time axis
  plot(time, temp, type = "l", xaxt = "n")
  r <- as.POSIXct(round(range(time), "hours"))
  axis.POSIXct(1, at = seq(r[1], r[2], by = "hour"), format = "%H")
  # place the grid
  abline(v=axTicks.POSIXct(1, at = seq(r[1], r[2], by = "hour"), format = "%H"),
         col="grey", lty="dotted")
})