Find the Midpoints of a Numeric Vector
Midx.RdCalculate the midpoints of a sequence of numbers. This is e.g. useful for labelling stacked barplots.
Midx(x, incl.zero = FALSE, cumulate = FALSE)Arguments
Value
numeric vector with the calculated midpoins
See also
Examples
x <- c(1, 3, 6, 7)
Midx(x)
#> [1] 2.0 4.5 6.5
Midx(x, incl.zero = TRUE)
#> [1] 0.5 2.0 4.5 6.5
Midx(x, incl.zero = TRUE, cumulate = TRUE)
#> [1] 0.5 2.5 7.0 13.5
# an alternative to
head(MoveAvg(c(0, x), order = 2, align = "l"), n = -1)
#> [1] 0.5 2.0 4.5 6.5
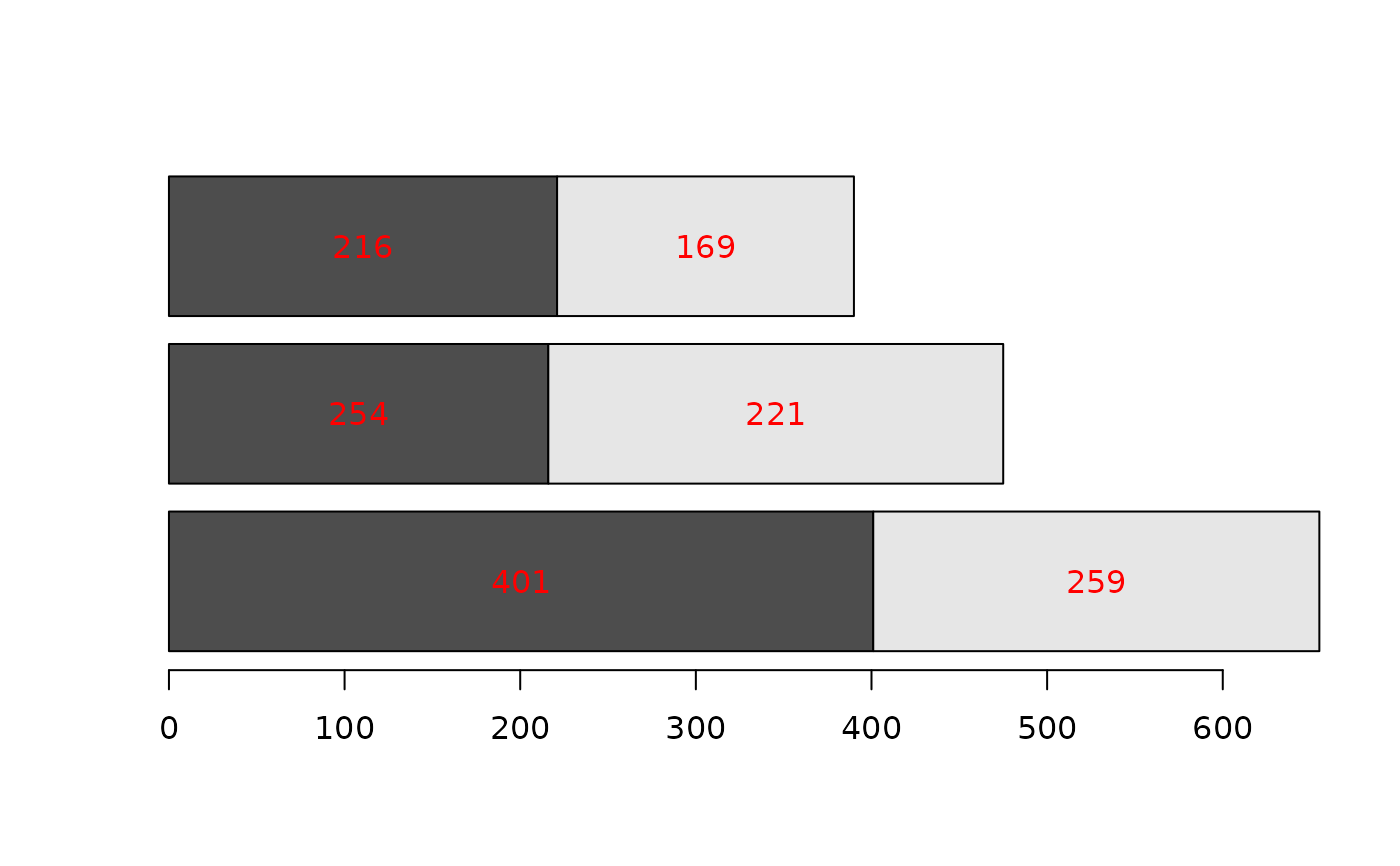
tab <- matrix(c(401,216,221,254,259,169), nrow=2, byrow=TRUE)
b <- barplot(tab, beside = FALSE, horiz=TRUE)
x <- t(apply(tab, 2, Midx, incl.zero=TRUE, cumulate=TRUE))
text(tab, x=x, y=b, col="red")