Create a Factor Variable by Cutting an Age Variable
CutAge.RdDividing the range of an age variable x into intervals is a frequent task. The commonly used function cut has unfavourable default values for this.
CutAge() is a convenient wrapper for cutting age variables in groups
of e.g. 10 years with more suitable defaults.CutGen yields the generation of a person based on the year of birth.
Arguments
- x
continuous variable.
- breaks
either a numeric vector of two or more unique cut points or a single number (greater than or equal to 2) giving the number of intervals into which x is to be cut. Default is 10-year intervals from 0 to 90.
- right
logical, indicating if the intervals should be closed on the right (and open on the left) or vice versa. Default is
FALSE- unlike incut!- ordered_result
logical: should the result be an ordered factor? Default is
TRUE- unlike incut!- full
logical, setting to
FALSEwill remove empty levels at the edges of the distribution- labels
labels for the levels. When set to
TRUEthe age ranges will be 00-09, 10-19, 20-29, etc.- ...
the dots are passed on to the underlying function
cut(). Use these for e.g. change the labels.- vintage
year of birth
Details
The generations are defined as:
1946-1964 Babyboomer
1965-1979 Generation X
1980-1995 Generation Y – also known as Millennials
1996-2010 Generation Z
2011-.... Generation Alpha
Value
A factor is returned, unless labels = FALSE which results in an integer vector of level codes.
Values which fall outside the range of breaks are coded as NA, as are NaN and NA values.
Examples
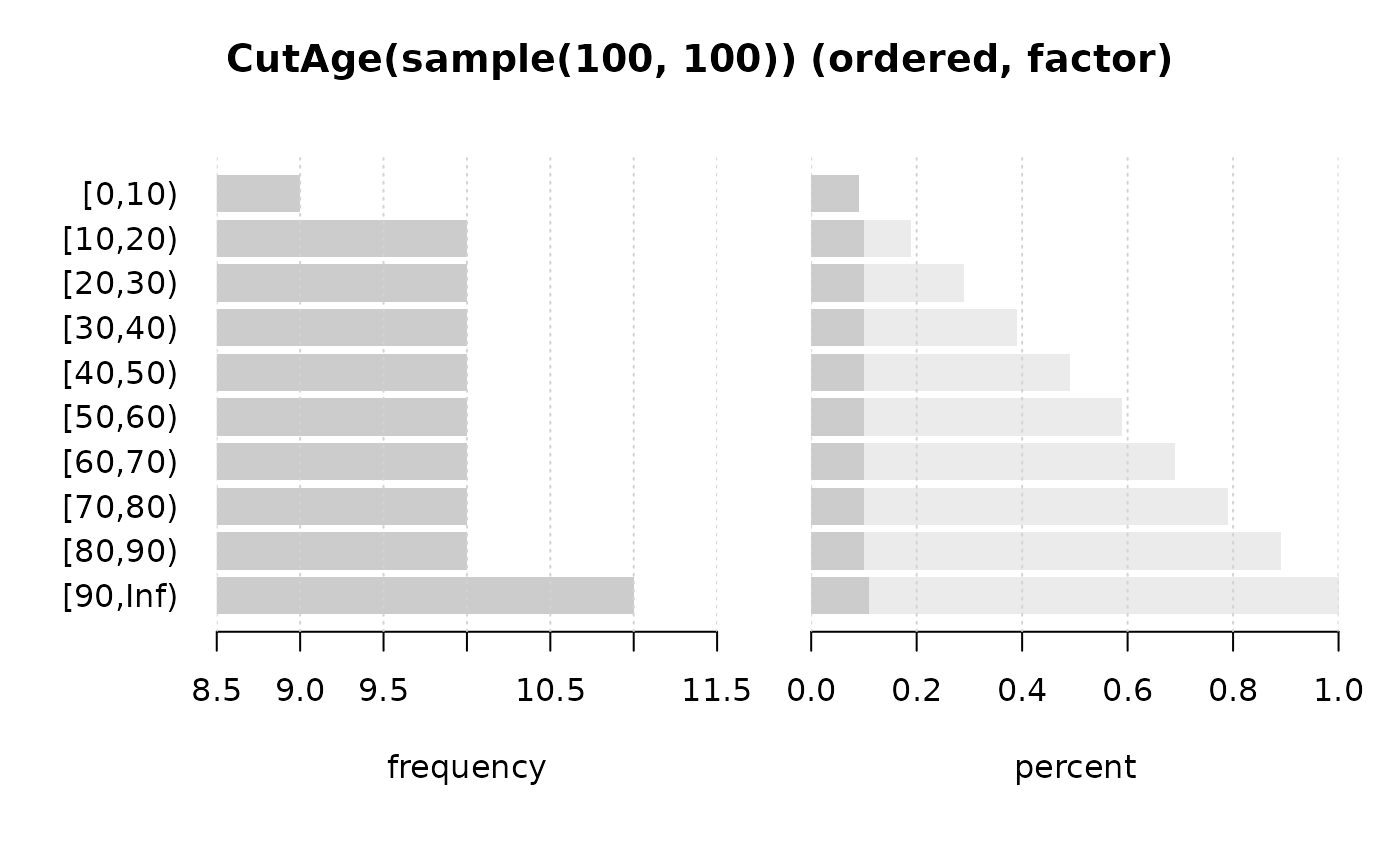
Desc(CutAge(sample(100, 100)))
#> ──────────────────────────────────────────────────────────────────────────────
#> CutAge(sample(100, 100)) (ordered, factor)
#>
#>   length      n    NAs unique levels  dupes
#>      100    100      0     10     10      y
#>          100.0%   0.0%
#>
#>        level  freq   perc  cumfreq  cumperc
#> 1     [0,10)     9   9.0%        9     9.0%
#> 2    [10,20)    10  10.0%       19    19.0%
#> 3    [20,30)    10  10.0%       29    29.0%
#> 4    [30,40)    10  10.0%       39    39.0%
#> 5    [40,50)    10  10.0%       49    49.0%
#> 6    [50,60)    10  10.0%       59    59.0%
#> 7    [60,70)    10  10.0%       69    69.0%
#> 8    [70,80)    10  10.0%       79    79.0%
#> 9    [80,90)    10  10.0%       89    89.0%
#> 10  [90,Inf)    11  11.0%      100   100.0%
#>